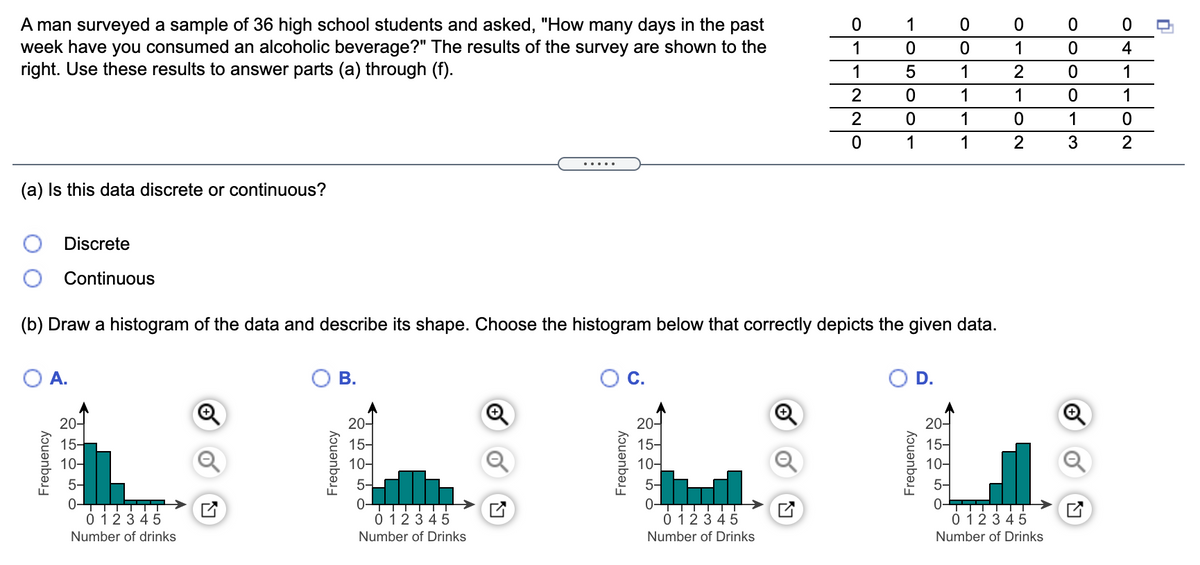
A man surveyed a sample of 36 high school students and asked, "How many days in the past week have you consumed an alcoholic beverage?" The results of the survey are shown to the right. Use these results to answer parts (a) through (f). .....
A man surveyed a sample of 36 high school students and asked, "How many days in the past week have you consumed an alcoholic beverage?" The results of the survey are shown to the right. Use these results to answer parts (a) through (f). .....

Chapter5: Exponential And Logarithmic Functions
Section5.5: Exponential And Logarithmic Models
Problem 4ECP

Related questions
Question
Transcribed Image Text:A man surveyed a sample of 36 high school students and asked, "How many days in the past
week have you consumed an alcoholic beverage?" The results of the survey are shown to the
right. Use these results to answer parts (a) through (f).
1
1
1
4
1
1
2
1
2
1
1
1
1
1
1
1
2
2
.... .
(a) Is this data discrete or continuous?
Discrete
Continuous
(b) Draw a histogram of the data and describe its shape. Choose the histogram below that correctly depicts the given data.
O A.
В.
С.
D.
20-
20-
15-
10-
20-
20-
15-
10-
5-
15-
10-
15-
10-
5-
5-
5-
0-TTT
0 123 45
0 123 45
0 123 45
0 123 45
Number of drinks
Number of Drinks
Number of Drinks
Number of Drinks
Frequency
Frequency
Frequency
Frequency
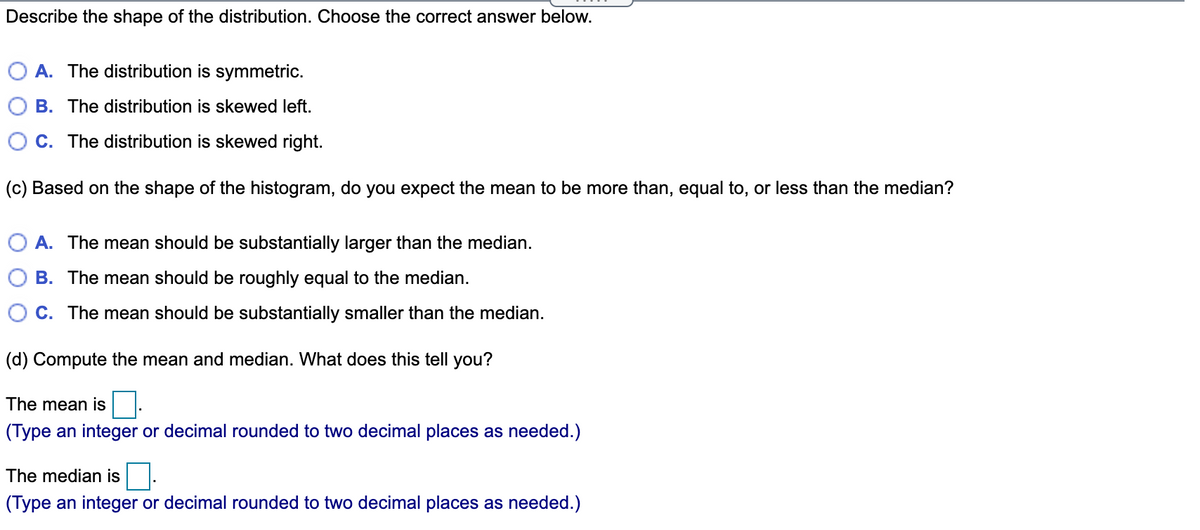
Transcribed Image Text:Describe the shape of the distribution. Choose the correct answer below.
A. The distribution is symmetric.
B. The distribution is skewed left.
C. The distribution is skewed right.
(c) Based on the shape of the histogram, do you expect the mean to be more than, equal to, or less than the median?
A. The mean should be substantially larger than the median.
B. The mean should be roughly equal to the median.
O C. The mean should be substantially smaller than the median.
(d) Compute the mean and median. What does this tell you?
The mean is
(Type an integer or decimal rounded to two decimal places as needed.)
The median is.
(Type an integer or decimal rounded to two decimal places as needed.)
Expert Solution
This question has been solved!
Explore an expertly crafted, step-by-step solution for a thorough understanding of key concepts.

This is a popular solution!

Trending now
This is a popular solution!

Step by step
Solved in 3 steps with 1 images

Recommended textbooks for you

Trigonometry (MindTap Course List)
Trigonometry
ISBN:
9781337278461
Author:
Ron Larson
Publisher:
Cengage Learning

Glencoe Algebra 1, Student Edition, 9780079039897…
Algebra
ISBN:
9780079039897
Author:
Carter
Publisher:
McGraw Hill
Trigonometry (MindTap Course List)
Trigonometry
ISBN:
9781337278461
Author:
Ron Larson
Publisher:
Cengage Learning
Glencoe Algebra 1, Student Edition, 9780079039897…
Algebra
ISBN:
9780079039897
Author:
Carter
Publisher:
McGraw Hill