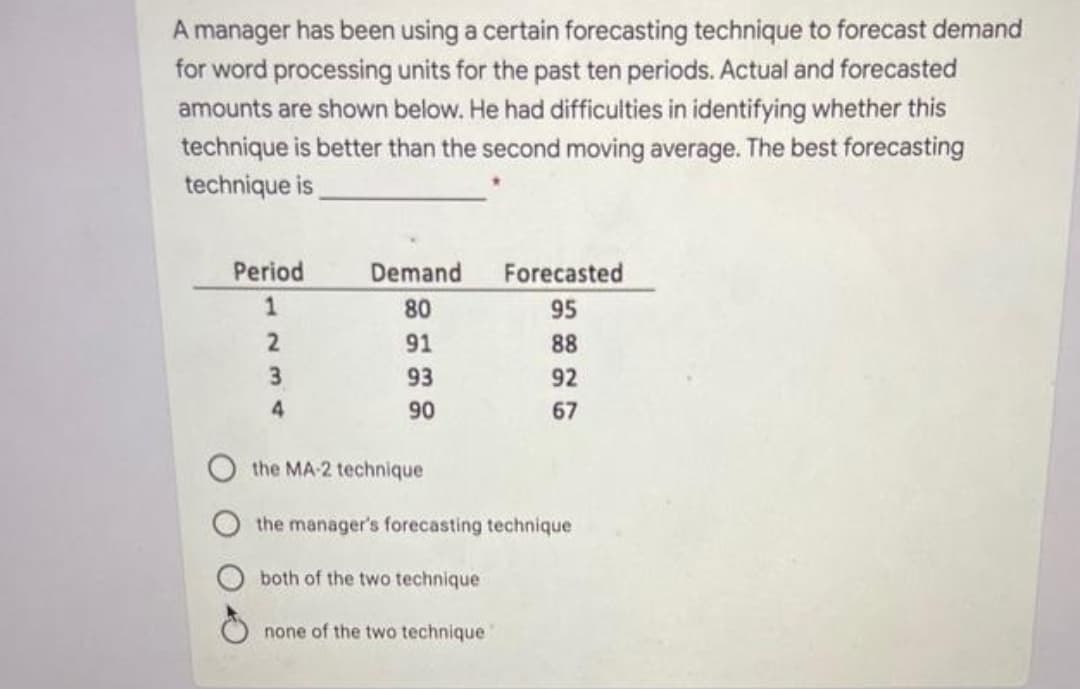
A manager has been using a certain forecasting technique to forecast demand for word processing units for the past ten periods. Actual and forecasted amounts are shown below. He had difficulties in identifying whether this technique is better than the second moving average. The best forecasting technique is


Q: Discuss Qualitative forecasting technique. Explain the situations where we use Qualitative methods.…
A: Forecasting is the process of making assumptions of the future on the basis of past and present data…
Q: In each of the following, name the term defined or answer the question. Answers are listed at the…
A: Note: I have answered for questions 1 to 3. Kindly post the remaining questions separately. 1)…
Q: Discuss when to use a time series forecasting techniques ?
A: Historical data, and hence projected variables, are subjected to statistical analysis. The…
Q: snip
A: When one forecasting technique is more accurate than another technique when applied to past data the…
Q: snip
A: The Delphi method is more qualitative. The Delphi method was developed by the Rank corporation in…
Q: he formula of exponential smoothing method of forecastin
A: Exponential smoothing is a time series forecasting method for univariate data. Exponential smoothing…
Q: hat are the benefits of exponential smoothing as a forecasting method over running averages
A: The advantages of the exponential smoothing over moving averages with respect to the forecasting…
Q: Choose the type of forecasting technique (survey, Delphi, averaging, seasonal, naive, trend,…
A: Delphi Technique of forecasting would be appropriate to predict the demand for vacations on the…
Q: Explain how do we measure accuracy of a forecasting model
A: We utilize the following criteria to determine a prediction model's efficiency:
Q: Explain why forecasting devices such as moving averages, weighted moving averages, and exponential…
A: The average is going The prediction is increased and n is flat, but less susceptible. It provides an…
Q: What is the forecast using exponential smoothing with alpha = .6? 2. If we decide to…
A: ANSWER IS AS FOLLOWS:
Q: Discuss the basic assumptions made when using time series forecasting techniques as opposed to…
A: Several assumptions are made during the Time Series Initial Phase.
Q: All forecasting methods using exponential smoothing, adaptive smoothing, and exponential smoothing…
A: Forecasting is the process of predicting future demand values based on historical data. The…
Q: What are the basic assumptions made when using time series forecasting techniques as opposed to…
A: Stationarity: The first assumption is that the series of data points are stationary. The series is…
Q: A police station had to deploy a police officer for an emergency multiple times in the last four…
A: F(t) = F(t-1) + (Alpha * (A(t-1) - F(t-1))) Where F(t-1) is the forecast for the previous period and…
Q: The number of fishing rods selling each day is given below. Perform analyses of the time series to…
A: Note: - Since we can answer up to three subparts, we will answer the first three subparts here. If…
Q: State and explain three methods that are used to determine the accuracy of any given forecasting…
A: To be determined: three methods that are used to determine the accuracy of any given forecasting…
Q: e least-squares regression method, the trend equation for forecasting is
A: Least square regression equation helps to identify the value of depending variable based on the…
Q: What does the term biased mean in reference to a particular forecasting technique?
A: The forecasting techniques are used for predicting the future demand and sales of the product. The…
Q: What th ree methods are used to determine the accuracy of any given forecasting method? How would…
A:
Q: You are required to collect data about corona virus cases since 1st of AUG 2020 till the day of…
A: The unprecedented Covid-19 has impacted the lives of people worldwide.
Q: Discuss when is time series forecasting used?
A: Forecasting is a strategy for forecasting future events using historical data and knowledge.
Q: a. Forecast the sales for the month of July using a 3-week moving average b. Forecast the sales for…
A: Since you have posted a question with multiple sub-parts, we will solve the first three subparts for…
Q: Alvin Cheah is a marketing analyst for Rockstar Travel Company. He wants to analyze the trend of…
A: Given information, Year Arrival Delayed Rate 2010 35.5 4.2 2011 28.00 3.8 2012 30.3 3.8…
Q: a) Forecast the demand for the week of October 12 using a 3-week moving average. b) Use a 3-week…
A: Forecasting is the process of estimating the future demand according to previous or historic…
Q: Which qualitative forecasting technique was developed to ensure that the input from every…
A: Delphi method.
Q: Three popular measures of forecast accuracy are:a) total error, average error, and mean error.b)…
A: Forecast accuracy is important because it ensures the reliability and validity of data. Forecasting…
Q: Explain what ex-post and ex-ante forecasts are, and how one can evaluate the accuracy of forecast of…
A: Ex Post Forecast, Ex Ante Forecast Ex post is forecasting using data that has been collected after…
Q: The accompanying dataset provides data on the monthly usage of natural gas (in millions of cubic…
A: Given data is Alpha = 0.6 Gamma = 0.8
Q: Explain the methods that are used to develop the forecasting methodology
A: Forecasting is a continuous activity that the business employs in both the short term and long term.…
Q: All forecasting methods using exponential smoothing, adaptive smoothing, and exponential smoothing…
A: Forecasting is the process of making assumptions of the future on the basis of past and present…
Q: Which qualitative forecasting technique was developed to ensure that the input fromevery participant…
A: Forecasting is the way toward making forecasts of things to depend on at various times information…
Q: You have a data set that includes time period and past sales data, and you want to use a time series…
A: Ans// D) Weighted moving average Time series forecasting makes the prediction about the future by…
Q: Discuss the time horizons for doing forecasting, and also identify 2 activities that are forecasted…
A: Forecasting is the strategy of anticipating what will be occurring soon it is utilized by numerical…
Q: Explain the trade off between responsiveness and consistency in a time series forecasting system?
A: Tradeoff A tradeoff is a decision-making technique that involves sacrificing quality, quantity, or…
Q: What three methods are used to determine the accuracy of any given forecasting method? How would you…
A: Forecasting is the process of making assumptions of future events based on past and present…
Q: An example of the Quantitative Method of forecasting is
A: Businesses and salespeople can use quantitative forecasting, an objective, data-based process, to…
Q: A police station had to deploy a police officer for an emergency multiple times in the last four…
A: Exponential smoothing helps in finding the forecasted demand using the previous data. It required…
Q: Your manager is trying to determine what forecasting method to use. Based upon the following…
A: In exponential smoothing, the smoothing constant is used to forecast the demand for the next period…
Q: How would you choose the appropriate number of factors to use in a forecasting model and how would…
A: Note: "Since you have asked multiple questions, we will solve the first question for you. If you…
Q: Explain how do exponential smoothing have benefits over shifting averages as forecasting tool
A: The merits of autoregressive moving as a prediction approach are considerable in comparison to…
Q: The manager of a popular tourist resort wants to use the manual trend projection forecasting…
A: The equation for exponential smoothing is- Ft = F t-1 + α(A t-1 – Ft-1) Ft = the exponentially…
Q: The following set of data represents the quarterly changes in demand for an item over the next 3…
A: When determining the direction of future trends, forecasting is a technique that makes educated…
Q: Identify and explain the areas other than mentioned where the Hard Rock Cafe could use forecasting…
A: Hard Rock Cafe, Inc. is a chain of subject eateries established in 1971 by Isaac Tigrett and Peter…
Q: Discuss the basic assumptions made when using time series forecasting techniques as apposed to…
A: Time series forecasting fundamental assumptions:
Q: State and explain the weakness of standard forecasting technique in forecasting approaches
A: To be determined: the weakness of standard forecasting technique
Q: a. Calculate the simple three-month moving average forecast for periods 4 to 12.
A: Since you have asked multiple questions, we will solve the first question for you. If you want any…


Trending now
This is a popular solution!

Step by step
Solved in 2 steps with 1 images

- The file P13_42.xlsx contains monthly data on consumer revolving credit (in millions of dollars) through credit unions. a. Use these data to forecast consumer revolving credit through credit unions for the next 12 months. Do it in two ways. First, fit an exponential trend to the series. Second, use Holts method with optimized smoothing constants. b. Which of these two methods appears to provide the best forecasts? Answer by comparing their MAPE values.The Baker Company wants to develop a budget to predict how overhead costs vary with activity levels. Management is trying to decide whether direct labor hours (DLH) or units produced is the better measure of activity for the firm. Monthly data for the preceding 24 months appear in the file P13_40.xlsx. Use regression analysis to determine which measure, DLH or Units (or both), should be used for the budget. How would the regression equation be used to obtain the budget for the firms overhead costs?The owner of a restaurant in Bloomington, Indiana, has recorded sales data for the past 19 years. He has also recorded data on potentially relevant variables. The data are listed in the file P13_17.xlsx. a. Estimate a simple regression equation involving annual sales (the dependent variable) and the size of the population residing within 10 miles of the restaurant (the explanatory variable). Interpret R-square for this regression. b. Add another explanatory variableannual advertising expendituresto the regression equation in part a. Estimate and interpret this expanded equation. How does the R-square value for this multiple regression equation compare to that of the simple regression equation estimated in part a? Explain any difference between the two R-square values. How can you use the adjusted R-squares for a comparison of the two equations? c. Add one more explanatory variable to the multiple regression equation estimated in part b. In particular, estimate and interpret the coefficients of a multiple regression equation that includes the previous years advertising expenditure. How does the inclusion of this third explanatory variable affect the R-square, compared to the corresponding values for the equation of part b? Explain any changes in this value. What does the adjusted R-square for the new equation tell you?
- The file P13_26.xlsx contains the monthly number of airline tickets sold by the CareFree Travel Agency. a. Create a time series chart of the data. Based on what you see, which of the exponential smoothing models do you think will provide the best forecasting model? Why? b. Use simple exponential smoothing to forecast these data, using a smoothing constant of 0.1. c. Repeat part b, but search for the smoothing constant that makes RMSE as small as possible. Does it make much of an improvement over the model in part b?The file P13_29.xlsx contains monthly time series data for total U.S. retail sales of building materials (which includes retail sales of building materials, hardware and garden supply stores, and mobile home dealers). a. Is seasonality present in these data? If so, characterize the seasonality pattern. b. Use Winters method to forecast this series with smoothing constants = = 0.1 and = 0.3. Does the forecast series seem to track the seasonal pattern well? What are your forecasts for the next 12 months?The file P13_28.xlsx contains monthly retail sales of U.S. liquor stores. a. Is seasonality present in these data? If so, characterize the seasonality pattern. b. Use Winters method to forecast this series with smoothing constants = = 0.1 and = 0.3. Does the forecast series seem to track the seasonal pattern well? What are your forecasts for the next 12 months?
- The file P13_22.xlsx contains total monthly U.S. retail sales data. While holding out the final six months of observations for validation purposes, use the method of moving averages with a carefully chosen span to forecast U.S. retail sales in the next year. Comment on the performance of your model. What makes this time series more challenging to forecast?The file P13_02.xlsx contains five years of monthly data on sales (number of units sold) for a particular company. The company suspects that except for random noise, its sales are growing by a constant percentage each month and will continue to do so for at least the near future. a. Explain briefly whether the plot of the series visually supports the companys suspicion. b. By what percentage are sales increasing each month? c. What is the MAPE for the forecast model in part b? In words, what does it measure? Considering its magnitude, does the model seem to be doing a good job? d. In words, how does the model make forecasts for future months? Specifically, given the forecast value for the last month in the data set, what simple arithmetic could you use to obtain forecasts for the next few months?The file P13_25.xlsx contains the quarterly numbers of applications for home mortgage loans at a branch office of Northern Central Bank. a. Create a time series chart of the data. Based on what you see, which of the exponential smoothing models do you think will provide the best forecasting model? Why? b. Use simple exponential smoothing to forecast these data, using a smoothing constant of 0.1. c. Repeat part b, but search for the smoothing constant that makes RMSE as small as possible. Does it make much of an improvement over the model in part b? Is it guaranteed to produce better forecasts for the future?
- Complete the forecasting worksheets for:NaïveAverageMoving AverageWeighted Moving Average using the weights of .8, .15, and .05 with .8 being the most current, then .15, then .05ExponA use an alpha level of .75ExponB use an alpha level of .25Exponential SolverWhat is the best alpha level as determined by the Exponential Solver?Which is the best forecasting option for MAE? What is the MAE?Which is the best forecasting option for MAPE? What is the MAPE? Period Sales This is the data for the forecasting template1 1152 1183 1284 1225 1356 1287 1358 1329 13210 135Following are two weekly forecasts made by two different methods for the number of gallons of gasoline, in thousands, demanded at a local gasoline station. Also shown are actual demand levels, in thousands of gallons. FORECAST Week Method 1 Method 2 Actual Demand 1 0.90 .80 .70 2 1.05 1.20 1.00 3 0.95 .90 1.00 4 1.20 1.11 1.00 What are the MAD and MSE for each method?2) Develop forecasts for FY2023 using the two forecasting methods currently employed by Throx. a) What are the forecast values that you calculated for each? Please be sure to showwork. b) What forecast do you recommend using? Please provide your rationale. c) Are there other considerations or recommendations that you would recommend toThrox about their forecast. PLEASE INCLUDE FORMULAS USED in EXCEL FORMAT. Trying to verify if formulas used were correct.

