A manufacturer of aluminum cans measured the level of impurities in 24 cans. The amounts of impurities, in percent, were as follows. 9.4 1.4 4.6 5.6 5.1 2.8 4.1 3.4 6.8 4.1 1.8 4.2 4.3 2.2 4.8 5.0 3.8 5.3 1.2 6.2 4.1 2.4 2.9 3.4 part 2. can or cannot for second bar.
A manufacturer of aluminum cans measured the level of impurities in 24 cans. The amounts of impurities, in percent, were as follows. 9.4 1.4 4.6 5.6 5.1 2.8 4.1 3.4 6.8 4.1 1.8 4.2 4.3 2.2 4.8 5.0 3.8 5.3 1.2 6.2 4.1 2.4 2.9 3.4 part 2. can or cannot for second bar.

Glencoe Algebra 1, Student Edition, 9780079039897, 0079039898, 2018
18th Edition
ISBN:9780079039897
Author:Carter
Publisher:Carter
Chapter10: Statistics
Section10.4: Distributions Of Data
Problem 7PPS

Related questions
Question
A manufacturer of aluminum cans measured the level of impurities in
24 cans. The amounts of impurities, in percent, were as follows.
|
9.4
|
1.4
|
4.6
|
5.6
|
5.1
|
2.8
|
4.1
|
3.4
|
|
6.8
|
4.1
|
1.8
|
4.2
|
4.3
|
2.2
|
4.8
|
5.0
|
|
3.8
|
5.3
|
1.2
|
6.2
|
4.1
|
2.4
|
2.9
|
3.4
|
part 2. can or cannot for second bar.
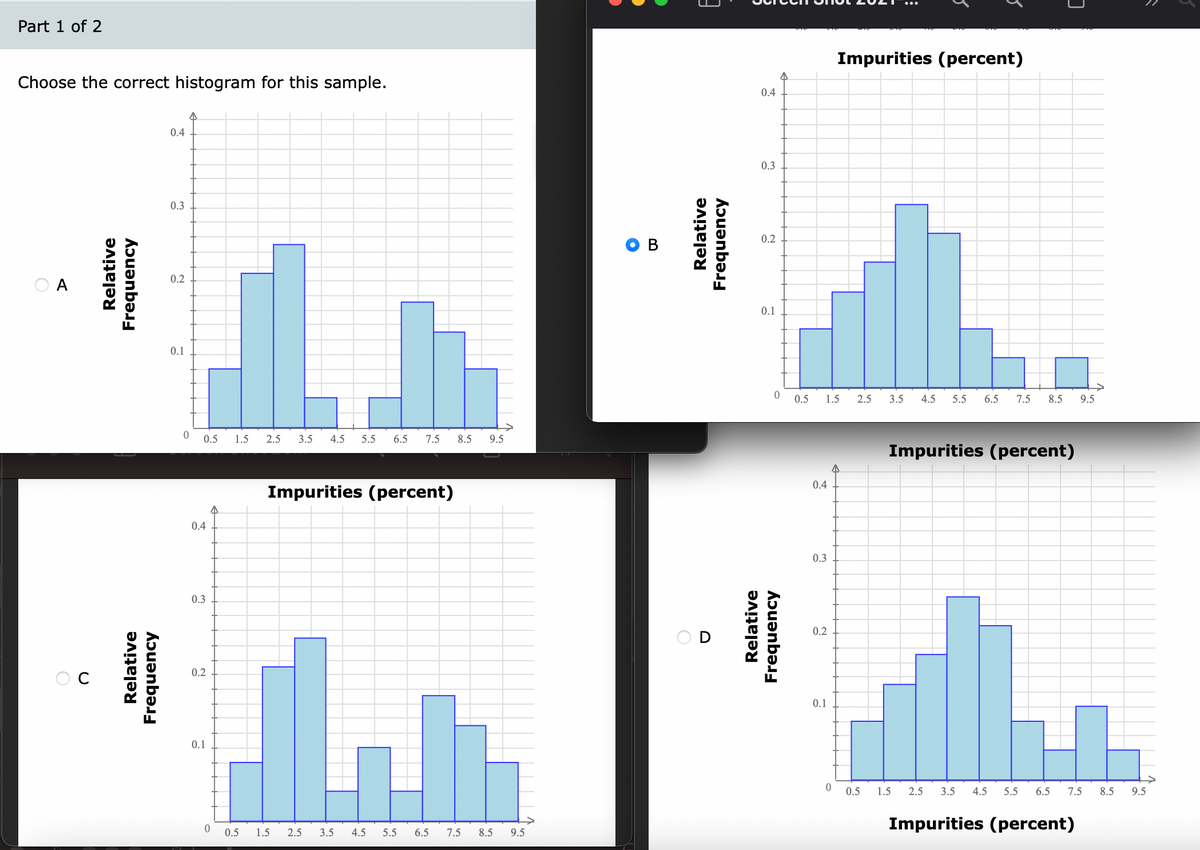
Transcribed Image Text:Part 1 of 2
Impurities (percent)
Choose the correct histogram for this sample.
0.4
0.4
0.3
0.3
0.2
0.2
0.1
0.1
0.5
1.5
2.5
3.5
4.5
5.5
6.5
7.5
8.5
9.5
0.5
1.5
2.5
3.5
4.5
5.5
6.5
7.5
8.5
9.5
Impurities (percent)
0.4
Impurities (percent)
0.4
0.3
0.3
0.2
0.2
0.1
0.1
0.5
1.5
2.5
3.5
4.5
5.5
6.5
7.5
8.5
9.5
Impurities (percent)
0.5
1.5
2.5
3.5
4.5
5.5
6.5
7.5
8.5
9.5
Relative
Relative
Frequency
Frequency
Relative
Frequency
Relative
Frequency
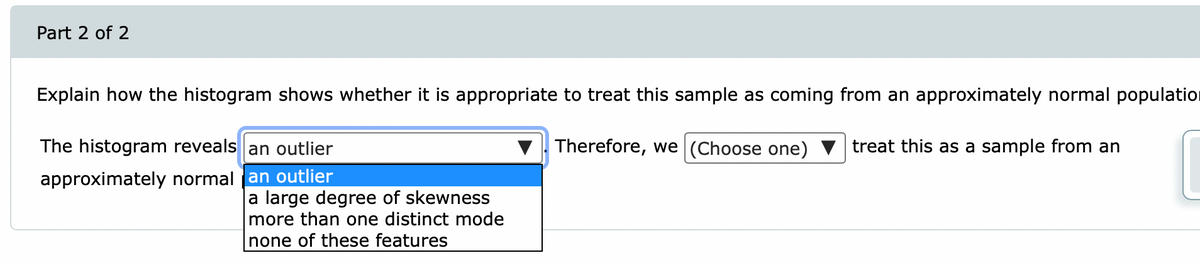
Transcribed Image Text:Part 2 of 2
Explain how the histogram shows whether it is appropriate to treat this sample as coming from an approximately normal population
The histogram reveals an outlier
Therefore, we (Choose one) ▼ treat this as a sample from an
approximately normal an outlier
a large degree of skewness
more than one distinct mode
none of these features
Expert Solution
This question has been solved!
Explore an expertly crafted, step-by-step solution for a thorough understanding of key concepts.

This is a popular solution!

Trending now
This is a popular solution!

Step by step
Solved in 2 steps with 2 images

Recommended textbooks for you
Glencoe Algebra 1, Student Edition, 9780079039897…
Algebra
ISBN:
9780079039897
Author:
Carter
Publisher:
McGraw Hill

Big Ideas Math A Bridge To Success Algebra 1: Stu…
Algebra
ISBN:
9781680331141
Author:
HOUGHTON MIFFLIN HARCOURT
Publisher:
Houghton Mifflin Harcourt
Glencoe Algebra 1, Student Edition, 9780079039897…
Algebra
ISBN:
9780079039897
Author:
Carter
Publisher:
McGraw Hill
Big Ideas Math A Bridge To Success Algebra 1: Stu…
Algebra
ISBN:
9781680331141
Author:
HOUGHTON MIFFLIN HARCOURT
Publisher:
Houghton Mifflin Harcourt