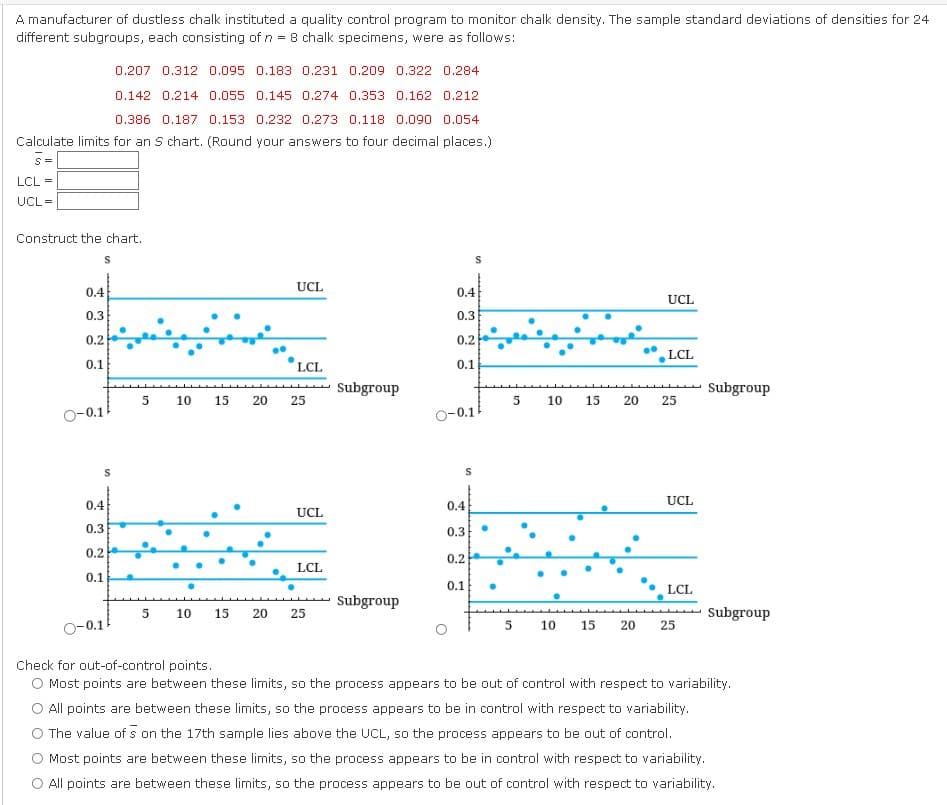
A manufacturer of dustless chalk instituted a quality control program to monitor chalk density. The sample standard deviations of densities for 24 different subgroups, each consisting of n = 8 chalk specimens, were as follows: 0.207 0.312 0.095 0.183 0.231 0.209 0.322 0.284 0.142 0.214 0.055 0.145 0.274 0.353 0.162 0.212 0.386 0.187 0.153 0.232 0.273 0.118 0.090 0.054 Calculate limits for an S chart. (Round your answers to four decimal places.) S= LCL = UCL= Construct the chart. S 0.4 0.3 0.2 0.1 O-0.1 S 0.4 0.3 0.2 0.1 5 5 10 10 15 20 UCL LCL 25 UCL LCL 15 20 25 Subgroup Subgroup 0.4 0.3 0.2 0.1 O-0.1 S S 0.4 0.3 0.2 0.1 5 10 15 20 UCL LCL 25 UCL LCL 5 10 15 20 25 Subgroup Subgroup Check for out-of-control points. O Most points are between these limits, so the process appears to be out of control with respect to variability. All points are between these limits, so the process appears to be in control with respect to variability. O The value of s on the 17th sample lies above the UCL, so the process appears to be out of control. O Most points are between these limits, so the process appears to be in control with respect to variability. O All points are between these limits, so the process appears to be out of control with respect to variability.
A manufacturer of dustless chalk instituted a quality control program to monitor chalk density. The sample standard deviations of densities for 24 different subgroups, each consisting of n = 8 chalk specimens, were as follows: 0.207 0.312 0.095 0.183 0.231 0.209 0.322 0.284 0.142 0.214 0.055 0.145 0.274 0.353 0.162 0.212 0.386 0.187 0.153 0.232 0.273 0.118 0.090 0.054 Calculate limits for an S chart. (Round your answers to four decimal places.) S= LCL = UCL= Construct the chart. S 0.4 0.3 0.2 0.1 O-0.1 S 0.4 0.3 0.2 0.1 5 5 10 10 15 20 UCL LCL 25 UCL LCL 15 20 25 Subgroup Subgroup 0.4 0.3 0.2 0.1 O-0.1 S S 0.4 0.3 0.2 0.1 5 10 15 20 UCL LCL 25 UCL LCL 5 10 15 20 25 Subgroup Subgroup Check for out-of-control points. O Most points are between these limits, so the process appears to be out of control with respect to variability. All points are between these limits, so the process appears to be in control with respect to variability. O The value of s on the 17th sample lies above the UCL, so the process appears to be out of control. O Most points are between these limits, so the process appears to be in control with respect to variability. O All points are between these limits, so the process appears to be out of control with respect to variability.

Glencoe Algebra 1, Student Edition, 9780079039897, 0079039898, 2018
18th Edition
ISBN:9780079039897
Author:Carter
Publisher:Carter
Chapter10: Statistics
Section10.4: Distributions Of Data
Problem 19PFA

Related questions
Question
Transcribed Image Text:A manufacturer of dustless chalk instituted a quality control program to monitor chalk density. The sample standard deviations of densities for 24
different subgroups, each consisting of n = 8 chalk specimens, were as follows:
0.207 0.312 0.095 0.183 0.231 0.209 0.322 0.284
0.142 0.214 0.055 0.145 0.274 0.353 0.162 0.212
0.386 0.187 0.153 0.232 0.273 0.118 0.090 0.054
Calculate limits for an S chart. (Round your answers to four decimal places.)
S=
LCL =
UCL=
Construct the chart.
S
0.4
0.3
0.2
0.1
O-0.1
S
0.4
0.3
0.2
0.1
5
5
10
15
20
10 15 20
UCL
LCL
25
UCL
LCL
25
Subgroup
Subgroup
0.4
0.3
0.2
0.1
O-0.1
S
S
0.4
0.3
0.2
0.1
5
10
15
20
UCL
LCL
25
UCL
LCL
5 10 15 20 25
Subgroup
Subgroup
Check for out-of-control points.
O Most points are between these limits, so the process appears to be out of control with respect to variability.
All points are between these limits, so the process appears to be in control with respect to variability.
O The value of s on the 17th sample lies above the UCL, so the process appears to be out of control.
O Most points are between these limits, so the process appears to be in control with respect to variability.
O All points are between these limits, so the process appears to be out of control with respect to variability.
Expert Solution
This question has been solved!
Explore an expertly crafted, step-by-step solution for a thorough understanding of key concepts.

Step by step
Solved in 4 steps with 4 images

Recommended textbooks for you
Glencoe Algebra 1, Student Edition, 9780079039897…
Algebra
ISBN:
9780079039897
Author:
Carter
Publisher:
McGraw Hill
Glencoe Algebra 1, Student Edition, 9780079039897…
Algebra
ISBN:
9780079039897
Author:
Carter
Publisher:
McGraw Hill