A manufacturer supplies DVD players to tetailers in batches of 20. Over the past 12 months the manufacturer had 30% of the players returned because they were faulty. (a) Give two reasons why a binomial distribution may be a suitable model for the numb of faulty DVD players in a batch. (b) Find the probability that a random batch of DVD players supplied by this manufacturer contains (i) (1) no faulty DVD players more than 4 faulty DVD players. (c) Find the mean and variance of the number of faulty DVD players in a batch
A manufacturer supplies DVD players to tetailers in batches of 20. Over the past 12 months the manufacturer had 30% of the players returned because they were faulty. (a) Give two reasons why a binomial distribution may be a suitable model for the numb of faulty DVD players in a batch. (b) Find the probability that a random batch of DVD players supplied by this manufacturer contains (i) (1) no faulty DVD players more than 4 faulty DVD players. (c) Find the mean and variance of the number of faulty DVD players in a batch

Chapter8: Sequences, Series,and Probability
Section8.7: Probability
Problem 4ECP: Show that the probability of drawing a club at random from a standard deck of 52 playing cards is...

Related questions
Question
only 1st
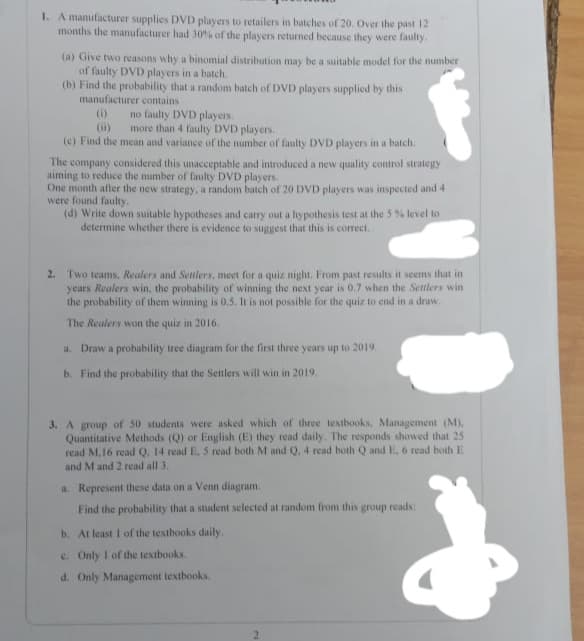
Transcribed Image Text:1. A manufacturer supplies DVD players to retailers in batches of 20. Over the past 12
months the manufacturer had 30% of the players returned because they were faulty.
(a) Give two reasons why a binomial distribution may be a suitable model for the number
of faulty DVD players in a batch.
(b) Find the probability that a random batch of DVD players supplied by this
manufacturer contains
no faulty DVD players.
more than 4 faulty DVD players.
(i)
(ii)
(c) Find the mean and variance of the number of faulty DVD players in a batch.
The company considered this unacceptable and introduced a new quality control strategy
aiming to reduce the number of faulty DVD players.
One month after the new strategy, a random batch of 20 DVD players was inspected and 4
were found faulty.
(d) Write down suitable hypotheses and carry out a hypothesis test at the 5 % level to
determine whether there is evidence to suggest that this is correct.
2. Two teams, Realers and Senlers, meet for a quiz night. From past results it seems that in
years Realers win, the probability of winning the next year is 0.7 when the Settlers win
the probability of them winning is 0,5. It is not possible for the quiz to end in a druw.
The Realers won the quiz in 2016.
a. Draw a probability tree diagram for the first three years up to 2019.
b. Find the probability that the Settlers will win in 2019.
3. A group of 50 students were asked which of three textbooks, Management (M),
Quantitative Methods (Q) or English (E) they read daily. The responds showed that 25
read M,16 read Q. 14 read E, 5 read both M and Q. 4 read both Q and E, 6 read both E
and M and 2 read all 3.
a. Represent these data on a Venn diagram.
Find the probability that a student selected at random from this group reads:
b. At least I of the textbooks daily.
c. Only I of the textbooks.
d. Only Management textbooks.
Expert Solution
This question has been solved!
Explore an expertly crafted, step-by-step solution for a thorough understanding of key concepts.

Step by step
Solved in 2 steps

Recommended textbooks for you