Develop an interval estimate for the difference between the average yearly incomes of the marketing managers in the East and West Use a= 05. At 95% confidence, use the p value approach and test to determine if the average b. yearly income of marketing managers in the East is significantly ditfferent from the. West
Develop an interval estimate for the difference between the average yearly incomes of the marketing managers in the East and West Use a= 05. At 95% confidence, use the p value approach and test to determine if the average b. yearly income of marketing managers in the East is significantly ditfferent from the. West

College Algebra (MindTap Course List)
12th Edition
ISBN:9781305652231
Author:R. David Gustafson, Jeff Hughes
Publisher:R. David Gustafson, Jeff Hughes
Chapter4: Polynomial And Rational Functions
Section4.2: Polynomial Functions
Problem 96E: What is the purpose of the Intermediate Value Theorem?

Related questions
Question
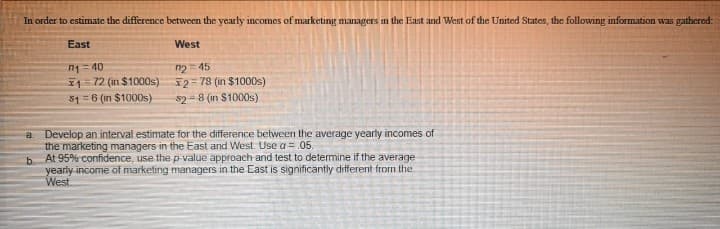
Transcribed Image Text:In order to estimate the difference between the yearly incomes of marketing managers in the East and West of the United States, the following information was gathered:
East
West
n1= 40
I1=72 (in $1000s) 2= 78 (in $1000s)
51 =6 (in $1000s)
n2= 45
s2 = 8 (in $1000s)
Develop an interval estimate for the difference between the average yearly incomes of
the marketing managers in the East and West. Use a = .05.
At 95% confidence, use the p-value approach and test to determine if the average
a.
b.
yearly income of marketing managers in the East is significantly different from the
West
Expert Solution
This question has been solved!
Explore an expertly crafted, step-by-step solution for a thorough understanding of key concepts.

This is a popular solution!

Trending now
This is a popular solution!

Step by step
Solved in 2 steps with 2 images

Recommended textbooks for you
College Algebra (MindTap Course List)
Algebra
ISBN:
9781305652231
Author:
R. David Gustafson, Jeff Hughes
Publisher:
Cengage Learning
College Algebra (MindTap Course List)
Algebra
ISBN:
9781305652231
Author:
R. David Gustafson, Jeff Hughes
Publisher:
Cengage Learning