A manufacturing company designed a Factorial Experiment to determine whether the number of defective parts produced by two machines (the "Sample" row in the ANOVA table) differed and if the number of defective parts produced also depended on whether the raw material needed by each machine was loaded manually or by an automatic feed system (the "Columns" row in the ANOVA table). Assuming that alpha is 0.05, and looking at the information in the "Sample" row in the ANOVA table, #1, would you Reject or Fail to Reject the Null hypothesis that the two Machines produce the same average number of defective parts? And, #2, EXPLAIN specifically what you used in the ANOVA table to arrive at your decision. ANOVA Source of Variation Sample Columns Interaction Within Total SS 52.08333333 4.083333333 18.75 34 108.9166667 df 1 1 1 8 11 MS F P-value 52.08333333 12.25490196 0.008070795 4.083333333 0.960784314 0.355697954 18.75 4.411764706 0.068892487 4.25
A manufacturing company designed a Factorial Experiment to determine whether the number of defective parts produced by two machines (the "Sample" row in the ANOVA table) differed and if the number of defective parts produced also depended on whether the raw material needed by each machine was loaded manually or by an automatic feed system (the "Columns" row in the ANOVA table). Assuming that alpha is 0.05, and looking at the information in the "Sample" row in the ANOVA table, #1, would you Reject or Fail to Reject the Null hypothesis that the two Machines produce the same average number of defective parts? And, #2, EXPLAIN specifically what you used in the ANOVA table to arrive at your decision. ANOVA Source of Variation Sample Columns Interaction Within Total SS 52.08333333 4.083333333 18.75 34 108.9166667 df 1 1 1 8 11 MS F P-value 52.08333333 12.25490196 0.008070795 4.083333333 0.960784314 0.355697954 18.75 4.411764706 0.068892487 4.25

Holt Mcdougal Larson Pre-algebra: Student Edition 2012
1st Edition
ISBN:9780547587776
Author:HOLT MCDOUGAL
Publisher:HOLT MCDOUGAL
Chapter11: Data Analysis And Probability
Section: Chapter Questions
Problem 8CR

Related questions
Question
Please help, not sure how to answer this :)
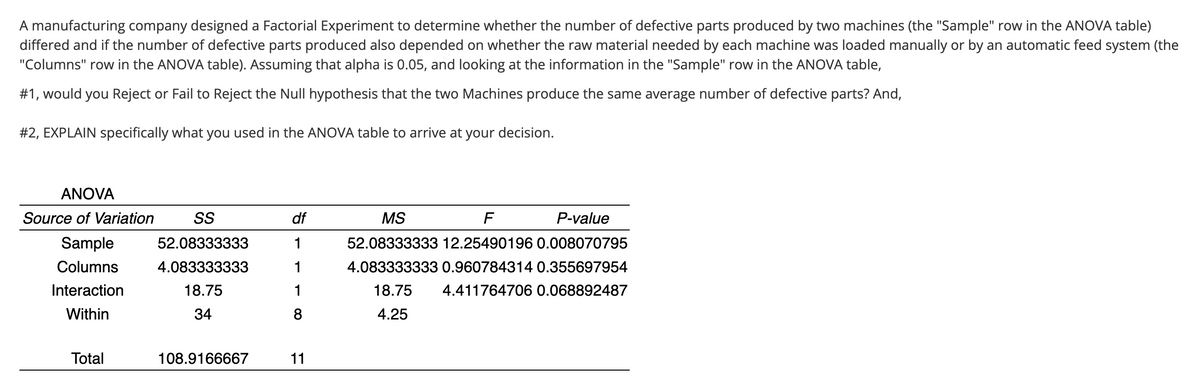
Transcribed Image Text:A manufacturing company designed a Factorial Experiment to determine whether the number of defective parts produced by two machines (the "Sample" row in the ANOVA table)
differed and if the number of defective parts produced also depended on whether the raw material needed by each machine was loaded manually or by an automatic feed system (the
"Columns" row in the ANOVA table). Assuming that alpha is 0.05, and looking at the information in the "Sample" row in the ANOVA table,
#1, would you Reject or Fail to Reject the Null hypothesis that the two Machines produce the same average number of defective parts? And,
#2, EXPLAIN specifically what you used in the ANOVA table to arrive at your decision.
ANOVA
Source of Variation
Sample
Columns
Interaction
Within
Total
SS
52.08333333
4.083333333
18.75
34
108.9166667
df
1
1
1
8
11
MS
F
P-value
52.08333333 12.25490196 0.008070795
4.083333333 0.960784314 0.355697954
18.75 4.411764706 0.068892487
4.25
Expert Solution
This question has been solved!
Explore an expertly crafted, step-by-step solution for a thorough understanding of key concepts.

Step by step
Solved in 3 steps

Recommended textbooks for you
Holt Mcdougal Larson Pre-algebra: Student Edition…
Algebra
ISBN:
9780547587776
Author:
HOLT MCDOUGAL
Publisher:
HOLT MCDOUGAL
Holt Mcdougal Larson Pre-algebra: Student Edition…
Algebra
ISBN:
9780547587776
Author:
HOLT MCDOUGAL
Publisher:
HOLT MCDOUGAL