A manufacturing firm has developed a skills test, the scores from which can be used to predict workers' production rating factors. 1 Click the icon to view the data on the test scores of various workers and their subsequent production ratings. a. Using POM for Windows' least squares-linear regression module, develop a relationship to forecast production ratings from test scores. (Round your responses and include a minus sign if necessary.) Y= - 23 + .945 x where Y = Production rating and X= Test score. b. If a worker's test score was 54, what would be your forecast of the worker's production rating? (Enter your response as an integer.) More info Test Score 55 Production Rating 43 Test Score Production Rating 57 Worker Worker K 58 B 38 43 L 75 75 93 87 M 67 48 86 77 31 26 E 88 82 62 49 F 66 68 24 25 G 55 47 Q 78 84 Clear all 50 46 34 32 41 41 S 51 58 69 74 T 39 30
A manufacturing firm has developed a skills test, the scores from which can be used to predict workers' production rating factors. 1 Click the icon to view the data on the test scores of various workers and their subsequent production ratings. a. Using POM for Windows' least squares-linear regression module, develop a relationship to forecast production ratings from test scores. (Round your responses and include a minus sign if necessary.) Y= - 23 + .945 x where Y = Production rating and X= Test score. b. If a worker's test score was 54, what would be your forecast of the worker's production rating? (Enter your response as an integer.) More info Test Score 55 Production Rating 43 Test Score Production Rating 57 Worker Worker K 58 B 38 43 L 75 75 93 87 M 67 48 86 77 31 26 E 88 82 62 49 F 66 68 24 25 G 55 47 Q 78 84 Clear all 50 46 34 32 41 41 S 51 58 69 74 T 39 30

Practical Management Science
6th Edition
ISBN:9781337406659
Author:WINSTON, Wayne L.
Publisher:WINSTON, Wayne L.
Chapter13: Regression And Forecasting Models
Section13.7: Exponential Smoothing Models
Problem 26P: The file P13_26.xlsx contains the monthly number of airline tickets sold by the CareFree Travel...

Related questions
Question
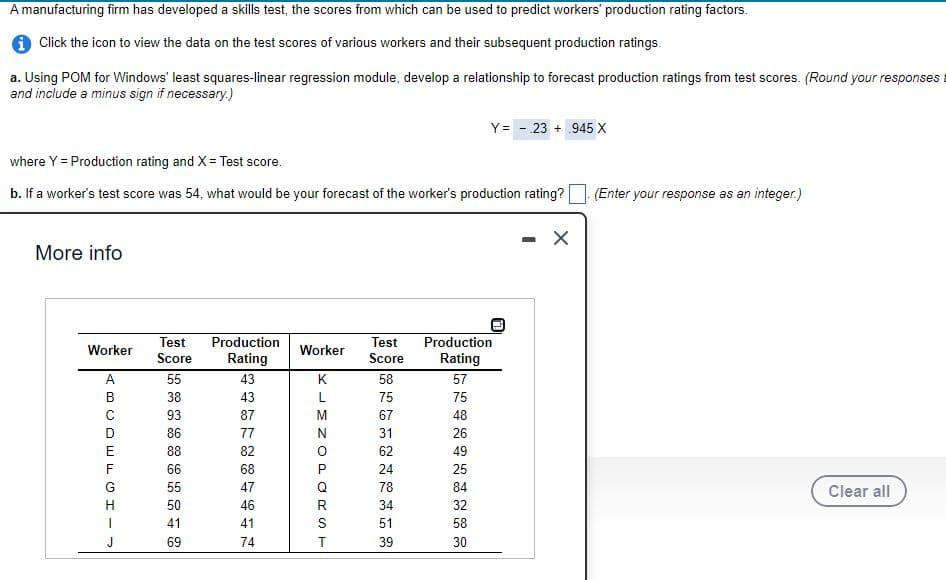
Transcribed Image Text:A manufacturing firm has developed a skills test, the scores from which can be used to predict workers' production rating factors.
1 Click the icon to view the data on the test scores of various workers and their subsequent production ratings.
a. Using POM for Windows' least squares-linear regression module, develop a relationship to forecast production ratings from test scores. (Round your responses
and include a minus sign if necessary.)
Y= - 23 + .945 X
where Y = Production rating and X= Test score.
b. If a worker's test score was 54, what would be your forecast of the worker's production rating?
(Enter your response as an integer.)
More info
Production
Rating
Test
Production
Test
Worker
Worker
Score
Rating
Score
A
55
43
K
58
57
B
38
43
75
75
93
87
M
67
48
86
77
31
26
E
88
82
62
49
F
66
68
24
25
G
55
47
Q
78
84
Clear all
H
50
46
R.
34
32
41
41
51
58
J
69
74
39
30
Expert Solution
This question has been solved!
Explore an expertly crafted, step-by-step solution for a thorough understanding of key concepts.

This is a popular solution!

Trending now
This is a popular solution!

Step by step
Solved in 2 steps with 1 images

Recommended textbooks for you
Practical Management Science
Operations Management
ISBN:
9781337406659
Author:
WINSTON, Wayne L.
Publisher:
Cengage,


Contemporary Marketing
Marketing
ISBN:
9780357033777
Author:
Louis E. Boone, David L. Kurtz
Publisher:
Cengage Learning
Practical Management Science
Operations Management
ISBN:
9781337406659
Author:
WINSTON, Wayne L.
Publisher:
Cengage,
Contemporary Marketing
Marketing
ISBN:
9780357033777
Author:
Louis E. Boone, David L. Kurtz
Publisher:
Cengage Learning
Marketing
Marketing
ISBN:
9780357033791
Author:
Pride, William M
Publisher:
South Western Educational Publishing