A marketing manager for a popular supermarket chain is investigating how the position of a new product within the store can help boost sales. Each of the 26 supermarket in the study displays the product in one of 4 possible locations and records how many units of the new product they have sold. Sample statistics of the sales volume data within each display location are provided in the table below: Display Location A: Next to the till Size Mean Variance 186 89 B: At the end of an aisle 171 70 C: Near the shop entrance D: Amongst similar products 6 180 86 9 188 87 Overall 26 Complete the following one-way ANOVA table using the provided summary statistics, show your workings. Provide a short concluding statement (at the 5% significance level) about the relationship between display location and sales volume for the new product. d.f. SS MS F р Between Error 85
A marketing manager for a popular supermarket chain is investigating how the position of a new product within the store can help boost sales. Each of the 26 supermarket in the study displays the product in one of 4 possible locations and records how many units of the new product they have sold. Sample statistics of the sales volume data within each display location are provided in the table below: Display Location A: Next to the till Size Mean Variance 186 89 B: At the end of an aisle 171 70 C: Near the shop entrance D: Amongst similar products 6 180 86 9 188 87 Overall 26 Complete the following one-way ANOVA table using the provided summary statistics, show your workings. Provide a short concluding statement (at the 5% significance level) about the relationship between display location and sales volume for the new product. d.f. SS MS F р Between Error 85

Glencoe Algebra 1, Student Edition, 9780079039897, 0079039898, 2018
18th Edition
ISBN:9780079039897
Author:Carter
Publisher:Carter
Chapter10: Statistics
Section10.3: Measures Of Spread
Problem 1GP

Related questions
Question
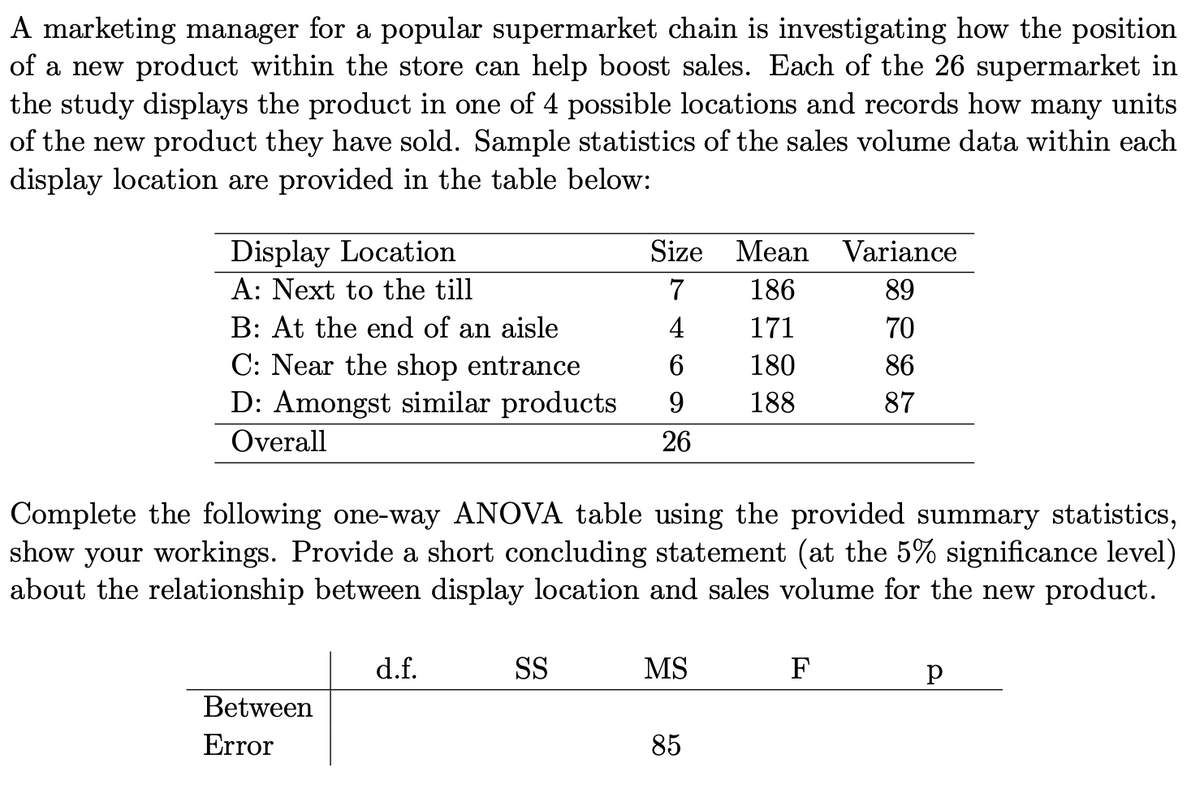
Transcribed Image Text:A marketing manager for a popular supermarket chain is investigating how the position
of a new product within the store can help boost sales. Each of the 26 supermarket in
the study displays the product in one of 4 possible locations and records how many units
of the new product they have sold. Sample statistics of the sales volume data within each
display location are provided in the table below:
Display Location
Size Mean Variance
A: Next to the till
7
186
89
B: At the end of an aisle
4
171
70
C: Near the shop entrance
6.
180
86
D: Amongst similar products
9.
188
87
Overall
26
Complete the following one-way ANOVA table using the provided summary statistics,
show your workings. Provide a short concluding statement (at the 5% significance level)
about the relationship between display location and sales volume for the new product.
d.f.
SS
MS
F
Between
Error
85
Expert Solution
This question has been solved!
Explore an expertly crafted, step-by-step solution for a thorough understanding of key concepts.

This is a popular solution!

Trending now
This is a popular solution!

Step by step
Solved in 3 steps

Recommended textbooks for you
Glencoe Algebra 1, Student Edition, 9780079039897…
Algebra
ISBN:
9780079039897
Author:
Carter
Publisher:
McGraw Hill
Glencoe Algebra 1, Student Edition, 9780079039897…
Algebra
ISBN:
9780079039897
Author:
Carter
Publisher:
McGraw Hill