A math teacher claims that she has developed a review course that increases the scores of students on the math portion of a college entrance exam. Based on data from the administrator of the exam, scores are normally distributed with μ=516.The teacher obtains a random sample of 2200 students, puts them through the review class, and finds that the mean math score of the 2200 students is 521 with a standard deviation
A math teacher claims that she has developed a review course that increases the scores of students on the math portion of a college entrance exam. Based on data from the administrator of the exam, scores are normally distributed with μ=516.The teacher obtains a random sample of 2200 students, puts them through the review class, and finds that the mean math score of the 2200 students is 521 with a standard deviation

Glencoe Algebra 1, Student Edition, 9780079039897, 0079039898, 2018
18th Edition
ISBN:9780079039897
Author:Carter
Publisher:Carter
Chapter10: Statistics
Section10.4: Distributions Of Data
Problem 19PFA

Related questions
Question
A math teacher claims that she has developed a review course that increases the scores of students on the math portion of a college entrance exam. Based on data from the administrator of the exam, scores are normally distributed with μ=516.The teacher obtains a random sample of 2200 students, puts them through the review class, and finds that the mean math score of the 2200 students is 521 with a standard deviation of 116. Complete parts (a) through (d) below.
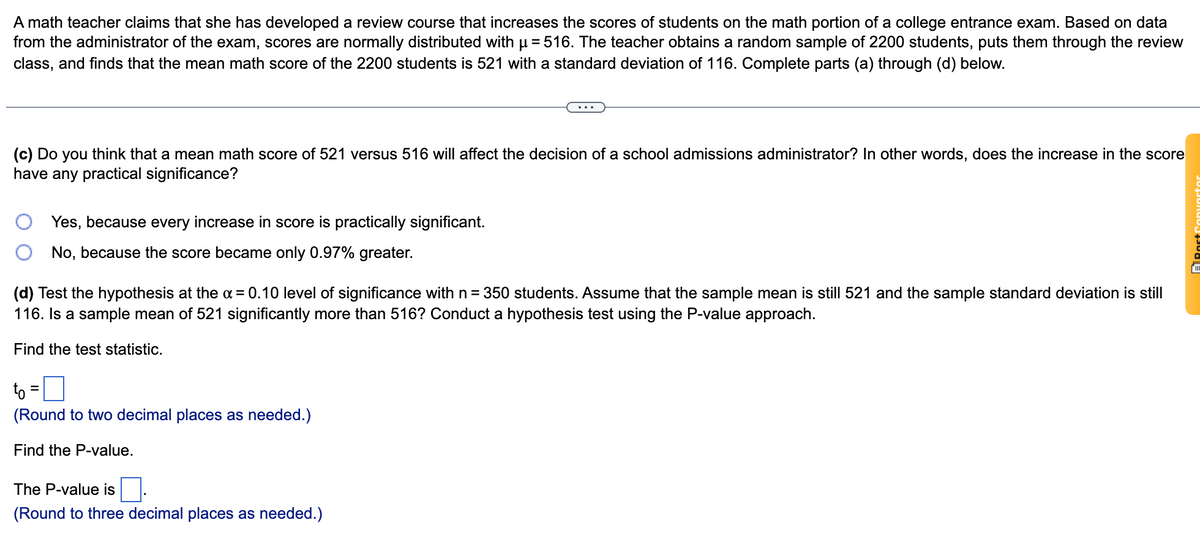
Transcribed Image Text:A math teacher claims that she has developed a review course that increases the scores of students on the math portion of a college entrance exam. Based on data
from the administrator of the exam, scores are normally distributed with u= 516. The teacher obtains a random sample of 2200 students, puts them through the review
class, and finds that the mean math score of the 2200 students is 521 with a standard deviation of 116. Complete parts (a) through (d) below.
(c) Do you think that a mean math score of 521 versus 516 will affect the decision of a school admissions administrator? In other words, does the increase in the score
have any practical significance?
Yes, because every increase in score is practically significant.
No, because the score became only 0.97% greater.
(d) Test the hypothesis at the a = 0.10 level of significance with n = 350 students. Assume that the sample mean is still 521 and the sample standard deviation is still
116. Is a sample mean of 521 significantly more than 516? Conduct a hypothesis test using the P-value approach.
Find the test statistic.
to
(Round to two decimal places as needed.)
Find the P-value.
The P-value is
(Round to three decimal places as needed.)
ARost
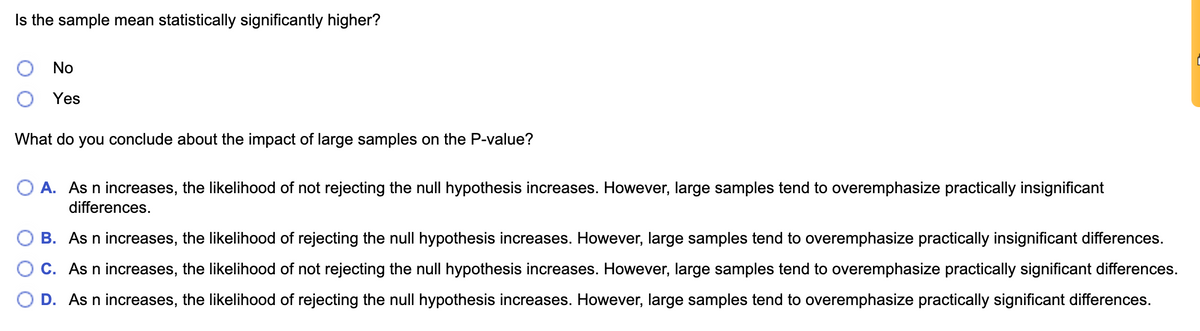
Transcribed Image Text:Is the sample mean statistically significantly higher?
No
Yes
What do you conclude about the impact of large samples on the P-value?
A. As n increases, the likelihood of not rejecting the null hypothesis increases. However, large samples tend to overemphasize practically insignificant
differences.
B. As n increases, the likelihood of rejecting the null hypothesis increases. However, large samples tend to overemphasize practically insignificant differences.
C. As n increases, the likelihood of not rejecting the null hypothesis increases. However, large samples tend to overemphasize practically significant differences.
D. As n increases, the likelihood of rejecting the null hypothesis increases. However, large samples tend to overemphasize practically significant differences.
Expert Solution
This question has been solved!
Explore an expertly crafted, step-by-step solution for a thorough understanding of key concepts.

This is a popular solution!

Trending now
This is a popular solution!

Step by step
Solved in 2 steps with 2 images

Recommended textbooks for you
Glencoe Algebra 1, Student Edition, 9780079039897…
Algebra
ISBN:
9780079039897
Author:
Carter
Publisher:
McGraw Hill
Glencoe Algebra 1, Student Edition, 9780079039897…
Algebra
ISBN:
9780079039897
Author:
Carter
Publisher:
McGraw Hill