A multiple regression analysis produced the following tables. Predictor Coefficients Standard Error t Statistic p-value Intercept -139.609 2548.989 -0.05477 0.957154 x 24.24619 22.25267 1.089586 0.295682 x 32.10171 17.44559 1.840105 0.08869 Source df SS MS F p-value Regression 2 302689 151344.5 1.705942 0.219838 Residual 13 1153309 88716.07 Total 15 1455998 Using = 0.01 to test the null hypothesis H :?1 = ?2 = 0, the critical F value is ____. 6.70 1.96 4.84 5.99 5.70
A multiple regression analysis produced the following tables. Predictor Coefficients Standard Error t Statistic p-value Intercept -139.609 2548.989 -0.05477 0.957154 x 24.24619 22.25267 1.089586 0.295682 x 32.10171 17.44559 1.840105 0.08869 Source df SS MS F p-value Regression 2 302689 151344.5 1.705942 0.219838 Residual 13 1153309 88716.07 Total 15 1455998 Using = 0.01 to test the null hypothesis H :?1 = ?2 = 0, the critical F value is ____. 6.70 1.96 4.84 5.99 5.70

Glencoe Algebra 1, Student Edition, 9780079039897, 0079039898, 2018
18th Edition
ISBN:9780079039897
Author:Carter
Publisher:Carter
Chapter4: Equations Of Linear Functions
Section4.6: Regression And Median-fit Lines
Problem 4GP

Related questions
Question
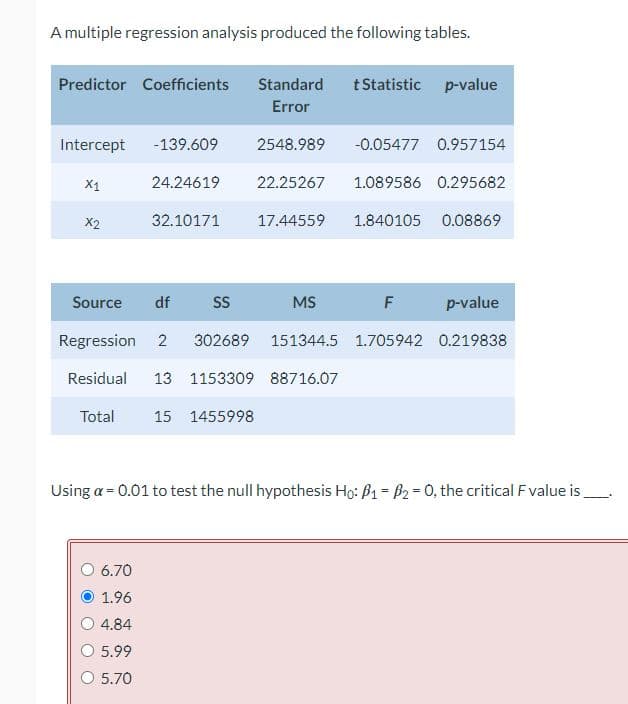
A multiple
Predictor Coefficients Standard
Error
t Statistic p-value
Intercept -139.609 2548.989 -0.05477 0.957154
x 24.24619 22.25267 1.089586 0.295682
x 32.10171 17.44559 1.840105 0.08869
Source df SS MS F p-value
Regression 2 302689 151344.5 1.705942 0.219838
Residual 13 1153309 88716.07
Total 15 1455998
Using = 0.01 to test the null hypothesis H :?1 = ?2 = 0, the critical F value is ____.
6.70
1.96
4.84
5.99
5.70
Transcribed Image Text:A multiple regression analysis produced the following tables.
Predictor Coefficients Standard
Error
Intercept -139.609
24.24619
X1
X2
32.10171
6.70
1.96
4.84
5.99
5.70
2548.989 -0.05477 0.957154
1.089586 0.295682
17.44559 1.840105 0.08869
22.25267
t Statistic p-value
Source df
SS
F
p-value
Regression 2 302689 151344.5 1.705942 0.219838
Residual 13 1153309 88716.07
Total 15 1455998
MS
Using a = 0.01 to test the null hypothesis Ho: B1-B₂ = 0, the critical F value is
Expert Solution
This question has been solved!
Explore an expertly crafted, step-by-step solution for a thorough understanding of key concepts.

Step by step
Solved in 2 steps with 1 images

Recommended textbooks for you
Glencoe Algebra 1, Student Edition, 9780079039897…
Algebra
ISBN:
9780079039897
Author:
Carter
Publisher:
McGraw Hill

Glencoe Algebra 1, Student Edition, 9780079039897…
Algebra
ISBN:
9780079039897
Author:
Carter
Publisher:
McGraw Hill