A nutritionist wants to determine how much time nationally people spend eating and drinking. Suppose for a random sample of 901 people age 15 or older, the mean amount of time spent eating or drinking per day is 1.85 hours with a standard deviation of 0.57 hour. Complete parts (a) through (d) below. Click the icon to view the table of critical t-values. (a) A histogram of time spent eating and drinking each day is skewed right. Use this result to explain why a large sample size is needed to construct a confidence interval for the mean time spent eating and drinking each day. OA. Since the distribution of time spent eating and drinking each day is highly skewed right, a large sample size is needed to minimize the margin of error to ensure only the peak of the sampling distribution is captured in the confidence interval. OB. Since the distribution of time spent eating and drinking each day is highly skewed right, a large sample size is needed to maximize the margin of error to ensure that both tails are accounted for in the confidence interval. OC. Since the distribution of time spent eating and drinking each day is highly skewed right, a large sample size is needed to ensure that it contains at least 5% of the population. OD. Since the distribution of time spent eating and drinking each day is highly skewed right, a large sample size is necessary to ensure that the distribution of the sample mean is approximately normal. (b) There are more than 200 million people nationally age 15 or older. Explain why this, along with the fact that the data were obtained using a random sample, satisfies the requirements for constructing a confidence interval.
A nutritionist wants to determine how much time nationally people spend eating and drinking. Suppose for a random sample of 901 people age 15 or older, the mean amount of time spent eating or drinking per day is 1.85 hours with a standard deviation of 0.57 hour. Complete parts (a) through (d) below. Click the icon to view the table of critical t-values. (a) A histogram of time spent eating and drinking each day is skewed right. Use this result to explain why a large sample size is needed to construct a confidence interval for the mean time spent eating and drinking each day. OA. Since the distribution of time spent eating and drinking each day is highly skewed right, a large sample size is needed to minimize the margin of error to ensure only the peak of the sampling distribution is captured in the confidence interval. OB. Since the distribution of time spent eating and drinking each day is highly skewed right, a large sample size is needed to maximize the margin of error to ensure that both tails are accounted for in the confidence interval. OC. Since the distribution of time spent eating and drinking each day is highly skewed right, a large sample size is needed to ensure that it contains at least 5% of the population. OD. Since the distribution of time spent eating and drinking each day is highly skewed right, a large sample size is necessary to ensure that the distribution of the sample mean is approximately normal. (b) There are more than 200 million people nationally age 15 or older. Explain why this, along with the fact that the data were obtained using a random sample, satisfies the requirements for constructing a confidence interval.

Glencoe Algebra 1, Student Edition, 9780079039897, 0079039898, 2018
18th Edition
ISBN:9780079039897
Author:Carter
Publisher:Carter
Chapter10: Statistics
Section: Chapter Questions
Problem 22SGR

Related questions
Question
A nutritionist wants to determine how much time nationally people spend eating and drinking. Suppose for a random sample of 901 people age 15 or older, the mean amount of time spent eating or drinking per day is 1.85 hours with a standard deviation of 0.57 hour.
Complete A, and B.
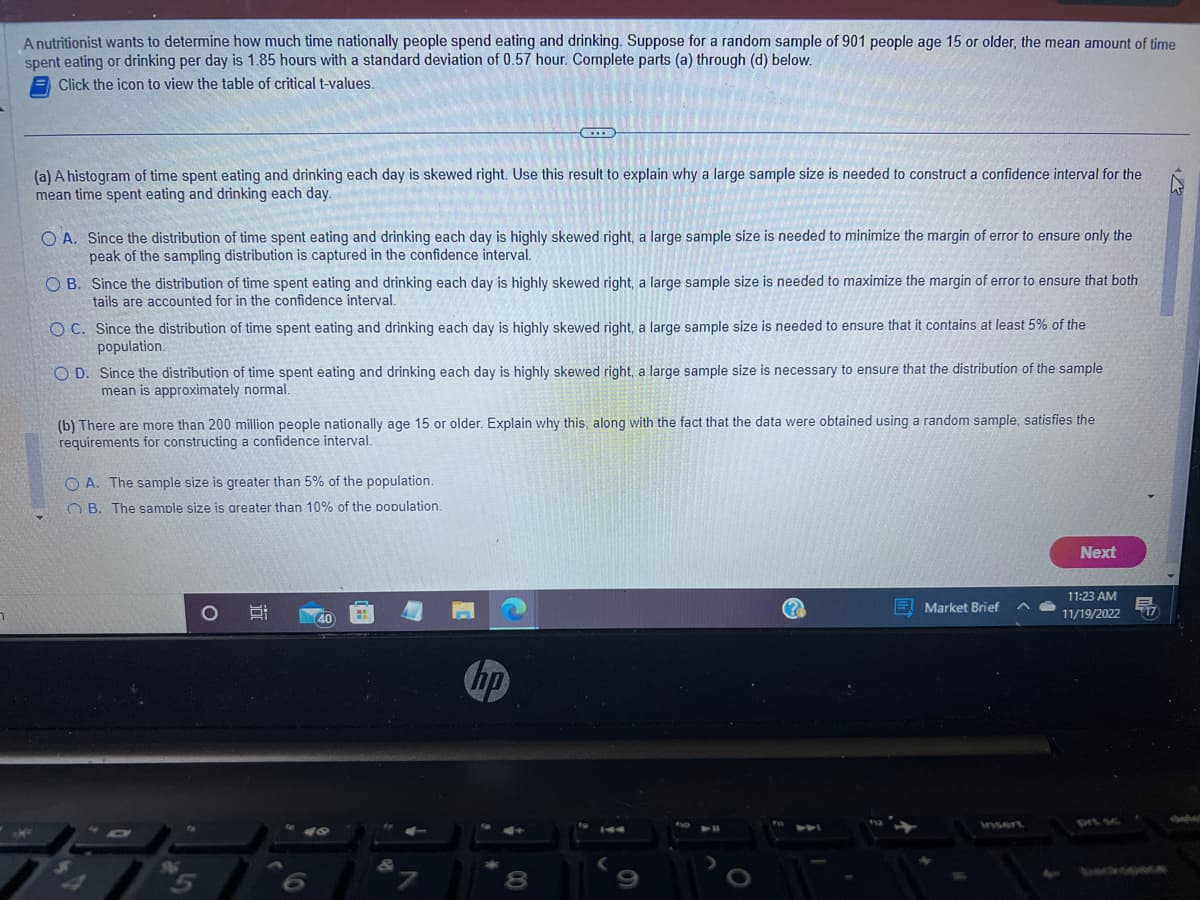
Transcribed Image Text:A nutritionist wants to determine how much time nationally people spend eating and drinking. Suppose for a random sample of 901 people age 15 or older, the mean amount of time
spent eating or drinking per day is 1.85 hours with a standard deviation of 0.57 hour. Complete parts (a) through (d) below.
Click the icon to view the table of critical t-values.
(a) A histogram of time spent eating and drinking each day is skewed right. Use this result to explain why a large sample size is needed to construct a confidence interval for the
mean time spent eating and drinking each day.
OA. Since the distribution of time spent eating and drinking each day is highly skewed right, a large sample size is needed to minimize the margin of error to ensure only the
peak of the sampling distribution is captured in the confidence interval.
OB. Since the distribution of time spent eating and drinking each day is highly skewed right, a large sample size is needed to maximize the margin of error to ensure that both
tails are accounted for in the confidence interval.
OC. Since the distribution of time spent eating and drinking each day is highly skewed right, a large sample size is needed to ensure that it contains at least 5% of the
population.
OD. Since the distribution of time spent eating and drinking each day is highly skewed right, a large sample size is necessary to ensure that the distribution of the sample
mean is approximately normal.
(b) There are more than 200 million people nationally age 15 or older. Explain why this, along with the fact that the data were obtained using a random sample, satisfies the
requirements for constructing a confidence interval.
OA. The sample size is greater than 5% of the population.
OB. The sample size is areater than 10% of the population.
40
40
hp
8
2
144
???
Market Brief
insert
Next
11:23 AM
11/19/2022
17
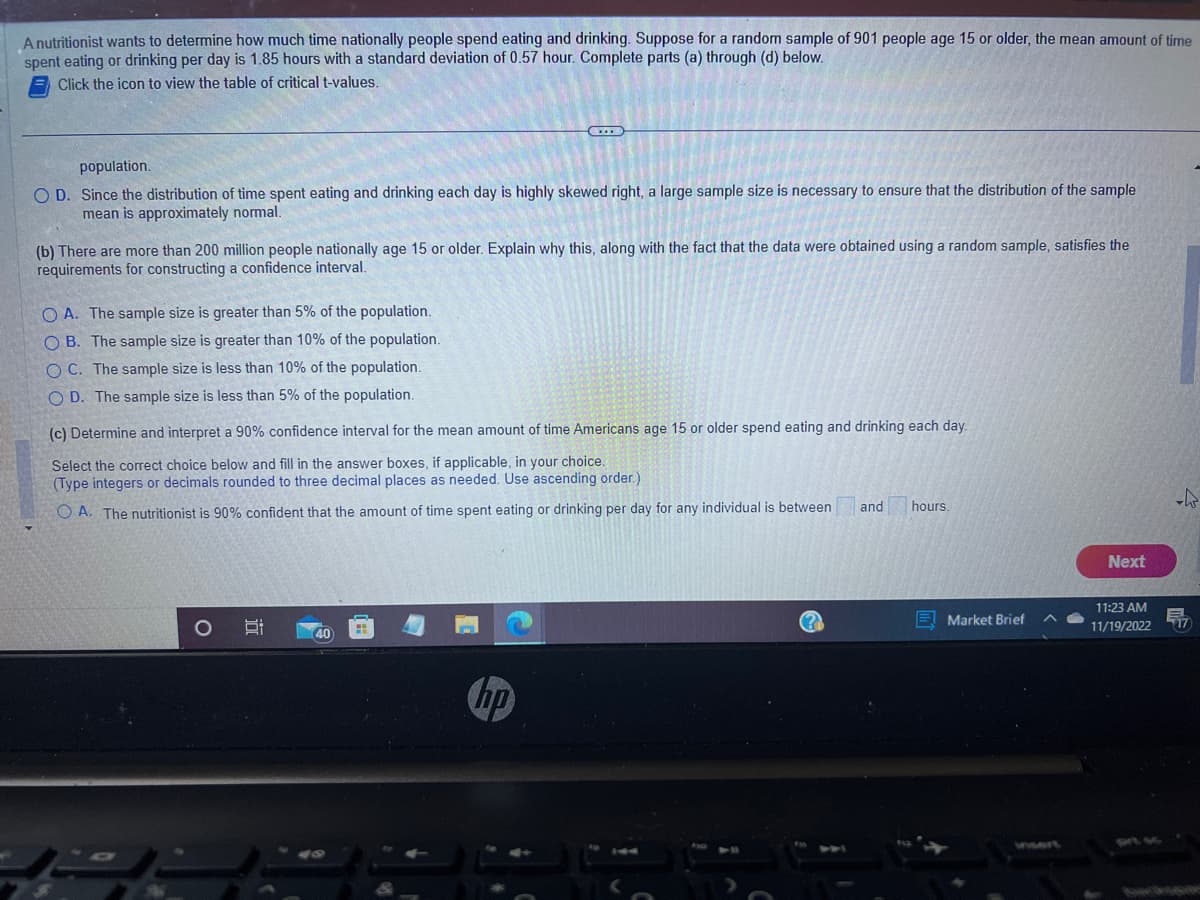
Transcribed Image Text:A nutritionist wants to determine how much time nationally people spend eating and drinking. Suppose for a random sample of 901 people age 15 or older, the mean amount of time
spent eating or drinking per day is 1.85 hours with a standard deviation of 0.57 hour. Complete parts (a) through (d) below.
Click the icon to view the table of critical t-values.
population.
OD. Since the distribution of time spent eating and drinking each day is highly skewed right, a large sample size is necessary to ensure that the distribution of the sample
mean is approximately normal.
(b) There are more than 200 million people nationally age 15 or older. Explain why this, along with the fact that the data were obtained using a random sample, satisfies the
requirements for constructing a confidence interval.
OA. The sample size is greater than 5% of the population.
OB. The sample size is greater than 10% of the population.
OC. The sample size is less than 10% of the population.
OD. The sample size is less than 5% of the population.
(c) Determine and interpret a 90% confidence interval for the mean amount of time Americans age 15 or older spend eating and drinking each day.
Select the correct choice below and fill in the answer
if applicable, in your choice.
(Type integers or decimals rounded to three decimal places as needed. Use ascending order.)
OA. The nutritionist is 90% confident that the amount of time spent eating or drinking per day for any individual is between
O
5:
...
40
#
hp
(?)
and hours.
Market Brief
Next
11:23 AM
11/19/2022
17
Expert Solution
This question has been solved!
Explore an expertly crafted, step-by-step solution for a thorough understanding of key concepts.

Step by step
Solved in 2 steps with 1 images

Recommended textbooks for you
Glencoe Algebra 1, Student Edition, 9780079039897…
Algebra
ISBN:
9780079039897
Author:
Carter
Publisher:
McGraw Hill
Glencoe Algebra 1, Student Edition, 9780079039897…
Algebra
ISBN:
9780079039897
Author:
Carter
Publisher:
McGraw Hill