A panel of judges was asked to judge the quality of different kinds of potato chips. The scatterplot and regression line below show the relationship between their ratings and the price of the chips. The fitted line has a slope of 5. What is the best interpretation of this slope? Choose 1 answer: B We would predict a bag of chips that cost $0 to have a rating of 5. We would predict a bag of chips that cost $0 to have a rating of -5. On average, each $5 increase in cost was associated with a 1 point increase in rating. On average, each $1 increase in cost was associated with a 5 point increase in rating.
A panel of judges was asked to judge the quality of different kinds of potato chips. The scatterplot and regression line below show the relationship between their ratings and the price of the chips. The fitted line has a slope of 5. What is the best interpretation of this slope? Choose 1 answer: B We would predict a bag of chips that cost $0 to have a rating of 5. We would predict a bag of chips that cost $0 to have a rating of -5. On average, each $5 increase in cost was associated with a 1 point increase in rating. On average, each $1 increase in cost was associated with a 5 point increase in rating.

Holt Mcdougal Larson Pre-algebra: Student Edition 2012
1st Edition
ISBN:9780547587776
Author:HOLT MCDOUGAL
Publisher:HOLT MCDOUGAL
Chapter8: Linear Functions
Section8.5: Slope-intercept Form
Problem 30E

Related questions
Question
Please sir if you can't solve stepwise with explanation in each step and also given information and final answer Along with the concept and also showing excel formula (wherever needed) please skip , if yes pls solve ill definitely rate the solution and dont do handwritten..
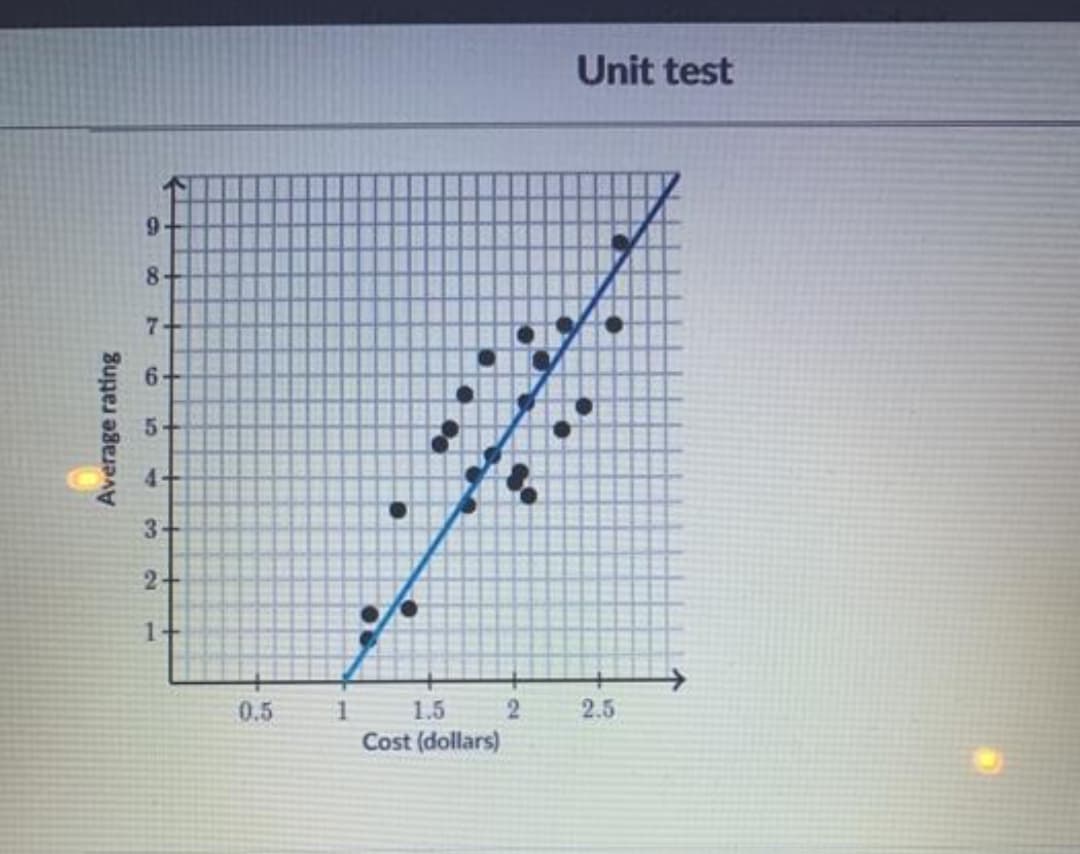
Transcribed Image Text:Average rating
9
8
7
6-
5.
4-
3-
2-
1+
0.5
#
1.5
Cost (dollars)
2
Unit test
2.5
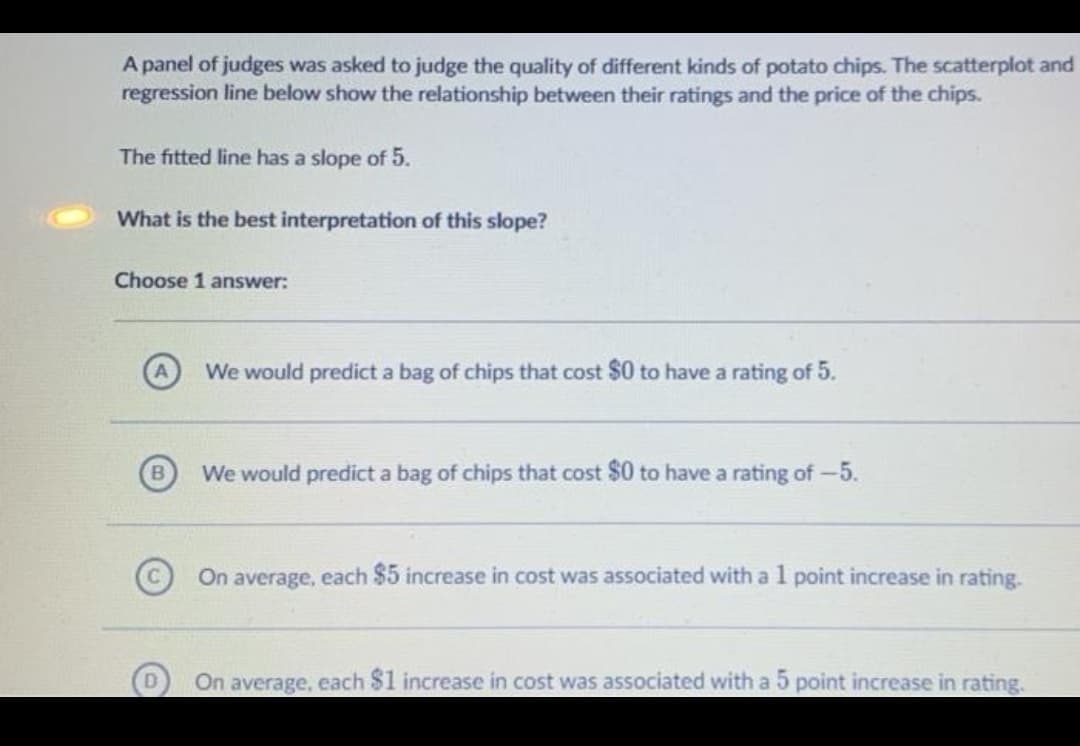
Transcribed Image Text:A panel of judges was asked to judge the quality of different kinds of potato chips. The scatterplot and
regression line below show the relationship between their ratings and the price of the chips.
The fitted line has a slope of 5.
What is the best interpretation of this slope?
Choose 1 answer:
D
We would predict a bag of chips that cost $0 to have a rating of 5.
We would predict a bag of chips that cost $0 to have a rating of -5.
On average, each $5 increase in cost was associated with a 1 point increase in rating.
On average, each $1 increase in cost was associated with a 5 point increase in rating.
Expert Solution
This question has been solved!
Explore an expertly crafted, step-by-step solution for a thorough understanding of key concepts.

This is a popular solution!

Trending now
This is a popular solution!

Step by step
Solved in 3 steps

Recommended textbooks for you
Holt Mcdougal Larson Pre-algebra: Student Edition…
Algebra
ISBN:
9780547587776
Author:
HOLT MCDOUGAL
Publisher:
HOLT MCDOUGAL

Intermediate Algebra
Algebra
ISBN:
9781285195728
Author:
Jerome E. Kaufmann, Karen L. Schwitters
Publisher:
Cengage Learning

Holt Mcdougal Larson Pre-algebra: Student Edition…
Algebra
ISBN:
9780547587776
Author:
HOLT MCDOUGAL
Publisher:
HOLT MCDOUGAL
Intermediate Algebra
Algebra
ISBN:
9781285195728
Author:
Jerome E. Kaufmann, Karen L. Schwitters
Publisher:
Cengage Learning

Elementary Algebra
Algebra
ISBN:
9780998625713
Author:
Lynn Marecek, MaryAnne Anthony-Smith
Publisher:
OpenStax - Rice University