不 A pediatrician wants to determine the relation that exists between a child's height, x, and head circumference, y. She randomly selects 11 children from her practice, measures their heights and head circumferences, and obtains the accompanying data. Complete parts (a) through (g) below. Click the icon to view the children's data. (a) Find the least-squares regression line treating height as the explanatory variable and head circumference as the response variable. y = x+(D (Round the slope to three decimal places and round the constant to one decimal place as needed.) Data Table Height (inches), x Head Circumference (inches), y D 27.75 17.8 24.75 17.3 25.75 17.4 26.25 17.7 25 17.1 28.25 17.9 26.75 17.5 27 17.7 26 26 27.5 Print 17.5 17.7 17.8 Done X
不 A pediatrician wants to determine the relation that exists between a child's height, x, and head circumference, y. She randomly selects 11 children from her practice, measures their heights and head circumferences, and obtains the accompanying data. Complete parts (a) through (g) below. Click the icon to view the children's data. (a) Find the least-squares regression line treating height as the explanatory variable and head circumference as the response variable. y = x+(D (Round the slope to three decimal places and round the constant to one decimal place as needed.) Data Table Height (inches), x Head Circumference (inches), y D 27.75 17.8 24.75 17.3 25.75 17.4 26.25 17.7 25 17.1 28.25 17.9 26.75 17.5 27 17.7 26 26 27.5 Print 17.5 17.7 17.8 Done X

Chapter4: Linear Functions
Section4.3: Fitting Linear Models To Data
Problem 34SE: For the following exercises, consider this scenario: The profit of a company decreased steadily...

Related questions
Question
Transcribed Image Text:st
e this
1:33
38%
K
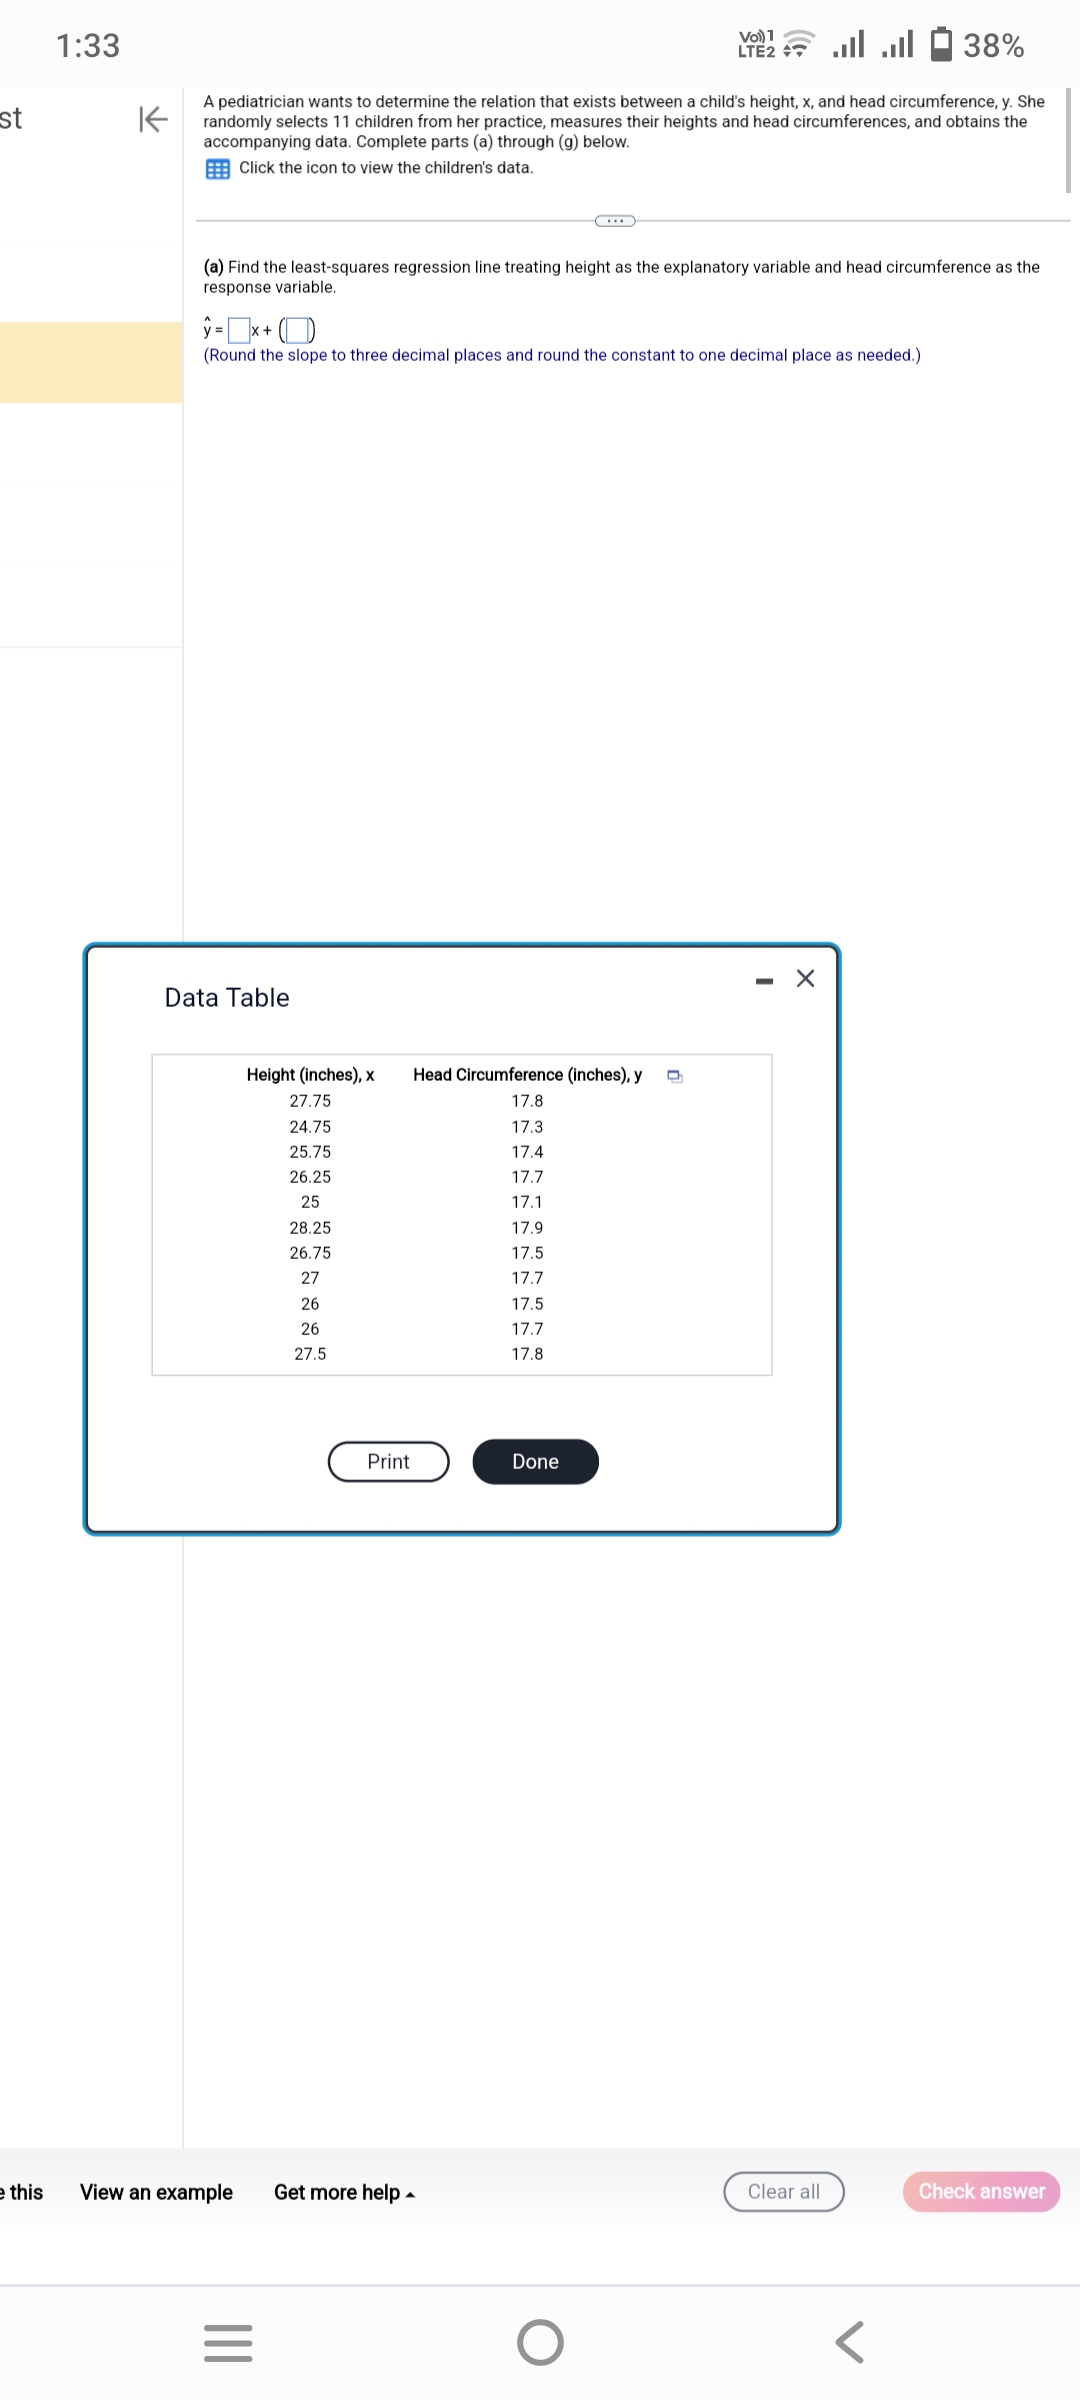
A pediatrician wants to determine the relation that exists between a child's height, x, and head circumference, y. She
randomly selects 11 children from her practice, measures their heights and head circumferences, and obtains the
accompanying data. Complete parts (a) through (g) below.
Click the icon to view the children's data.
(a) Find the least-squares regression line treating height as the explanatory variable and head circumference as the
response variable.
Data Table
y = X +
(Round the slope to three decimal places and round the constant to one decimal place as needed.)
View an example
Height (inches), X Head Circumference (inches), y D
27.75
17.8
24.75
17.3
25.75
17.4
26.25
17.7
25
17.1
28.25
17.9
26.75
17.5
27
17.7
26
26
27.5
|||
=
Print
Get more help.
(...)
17.5
17.7
17.8
1
LTE2 + ...
Done
O
X
Clear all
Check answer
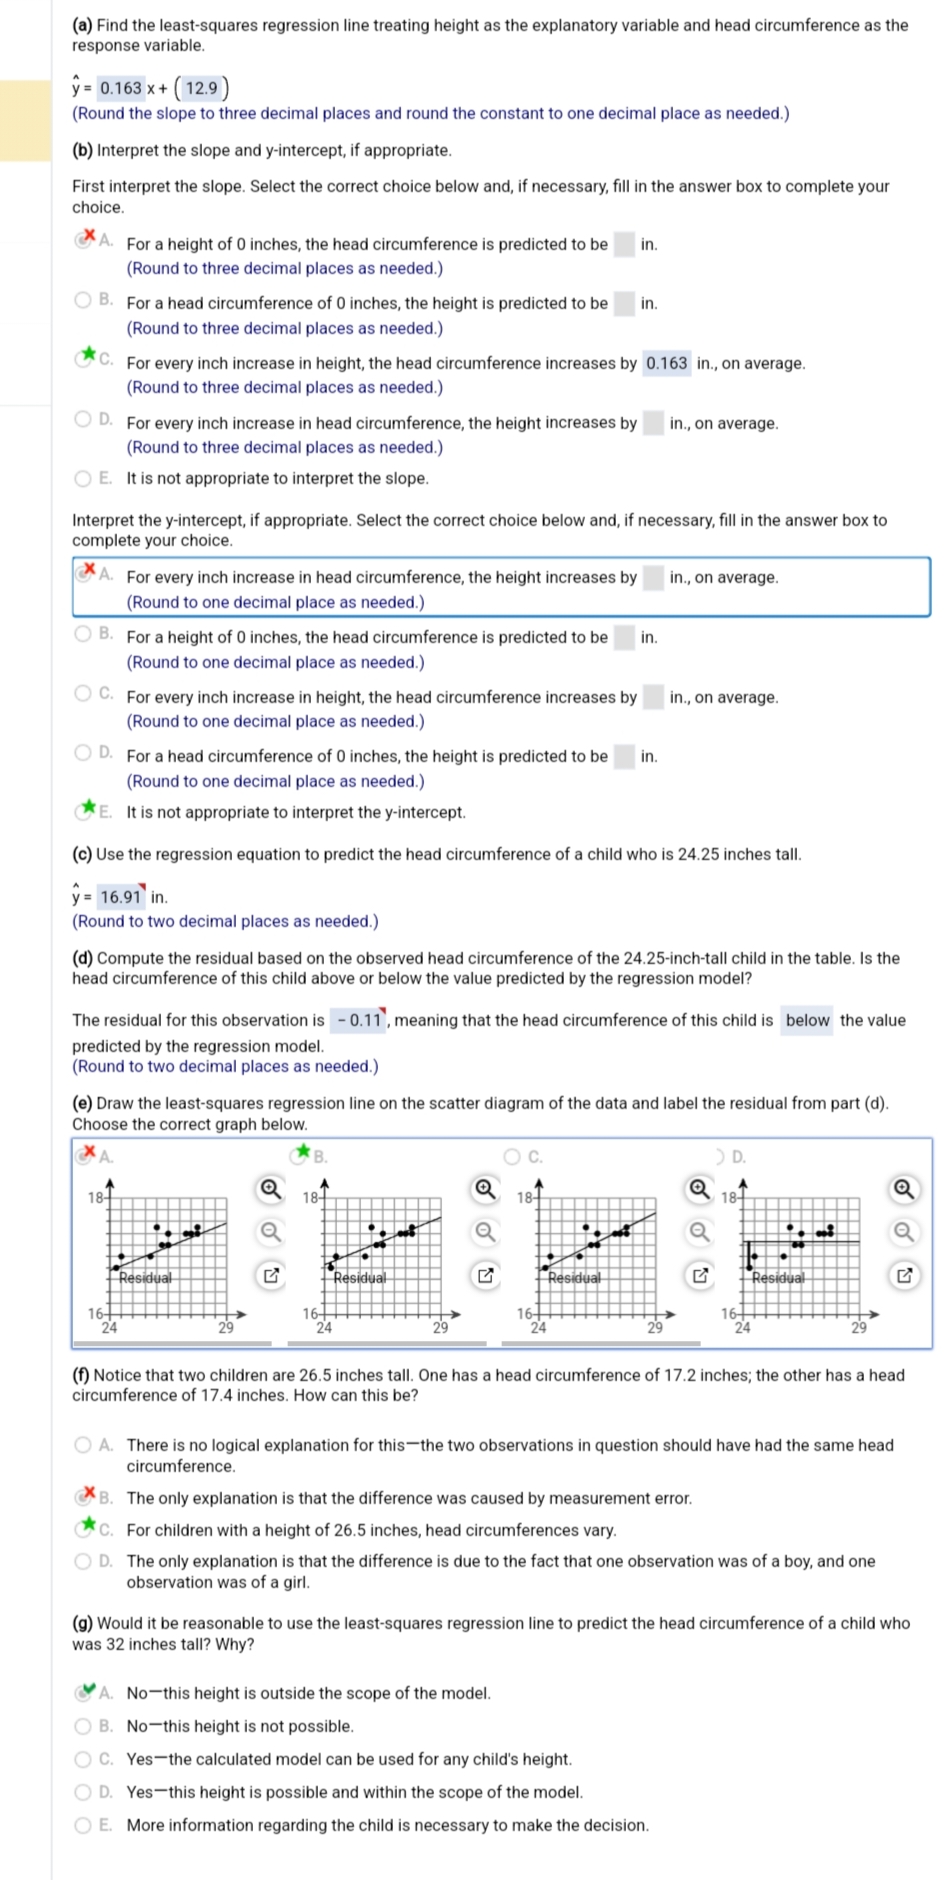
Transcribed Image Text:(a) Find the least-squares regression line treating height as the explanatory variable and head circumference as the
response variable.
y = 0.163 x + (12.9)
(Round the slope to three decimal places and round the constant to one decimal place as needed.)
(b) Interpret the slope and y-intercept, if appropriate.
First interpret the slope. Select the correct choice below and, if necessary, fill in the answer box to complete your
choice.
A. For a height of 0 inches, the head circumference is predicted to be
(Round to three decimal places as needed.)
OB. For a head circumference of 0 inches, the height is predicted to be
(Round to three decimal places as needed.)
OD. For every inch increase in head circumference, the height increases by
(Round to three decimal places as needed.)
OE. It is not appropriate to interpret the slope.
C. For every inch increase in height, the head circumference increases by 0.163 in., on average.
(Round to three decimal places as needed.)
A. For every inch increase in head circumference, the height increases by
(Round to one decimal place as needed.)
Interpret the y-intercept, if appropriate. Select the correct choice below and, if necessary, fill in the answer box to
complete your choice.
OC. For every inch increase in height, the head circumference increases by
(Round to one decimal place as needed.)
OB. For a height of 0 inches, the head circumference is predicted to be in.
(Round to one decimal place as needed.)
OD. For a head circumference of 0 inches, the height is predicted to be in.
(Round to one decimal place as needed.)
E. It is not appropriate to interpret the y-intercept.
18-
(c) Use the regression equation to predict the head circumference of a child who is 24.25 inches tall.
y = 16.91¹ in.
(Round to two decimal places as needed.)
16-
(d) Compute the residual based on the observed head circumference of the 24.25-inch-tall child in the table. Is the
head circumference of this child above or below the value predicted by the regression model?
24
The residual for this observation is 0.11, meaning that the head circumference of this child is below the value
predicted by the regression model.
(Round to two decimal places as needed.)
Residual
(e) Draw the least-squares regression line on the scatter diagram of the data and label the residual from part (d).
Choose the correct graph below.
Q
in.
18-
in.
16+
24
Residual
Q
C.
18-
in., on average.
16-
24
Residual
in., on average.
in., on average.
> D.
A. No-this height is outside the scope of the model.
OB. No-this height is not possible.
C. Yes the calculated model can be used for any child's height.
D. Yes this height is possible and within the scope of the model.
E. More information regarding the child is necessary to make the decision.
18-
16-
24
Residual
1
(f) Notice that two children are 26.5 inches tall. One has a head circumference of 17.2 inches; the other has a head
circumference of 17.4 inches. How can this be?
A. There is no logical explanation for this the two observations in question should have had the same head
circumference.
B. The only explanation is that the difference was caused by measurement error.
C. For children with a height of 26.5 inches, head circumferences vary.
D. The only explanation is that the difference is due to the fact that one observation was of a boy, and one
observation was of a girl.
(g) Would it be reasonable to use the least-squares regression line to predict the head circumference of a child who
was 32 inches tall? Why?
Expert Solution
This question has been solved!
Explore an expertly crafted, step-by-step solution for a thorough understanding of key concepts.

This is a popular solution!

Trending now
This is a popular solution!

Step by step
Solved in 2 steps with 1 images

Recommended textbooks for you

Glencoe Algebra 1, Student Edition, 9780079039897…
Algebra
ISBN:
9780079039897
Author:
Carter
Publisher:
McGraw Hill

Glencoe Algebra 1, Student Edition, 9780079039897…
Algebra
ISBN:
9780079039897
Author:
Carter
Publisher:
McGraw Hill

Algebra & Trigonometry with Analytic Geometry
Algebra
ISBN:
9781133382119
Author:
Swokowski
Publisher:
Cengage