A personality psychologist is interested if being a snob is heritable. To answer this question a personality psychologist recruits a huge sample of 2,593 identical twins and found that identical twins were similar in how snobby they were with an effect size of r=0.51. They also recruit a huge sample of 1,845 fraternal twins and found that fraternal twins were also similar in how snobby they were with an effect size of r=0.47. Calculate the heritability coefficient for being a snob. Remember that your data here is made up, so please don't tell your friends about how heritable their snobbishness is. Answer:
A personality psychologist is interested if being a snob is heritable. To answer this question a personality psychologist recruits a huge sample of 2,593 identical twins and found that identical twins were similar in how snobby they were with an effect size of r=0.51. They also recruit a huge sample of 1,845 fraternal twins and found that fraternal twins were also similar in how snobby they were with an effect size of r=0.47. Calculate the heritability coefficient for being a snob. Remember that your data here is made up, so please don't tell your friends about how heritable their snobbishness is. Answer:

Linear Algebra: A Modern Introduction
4th Edition
ISBN:9781285463247
Author:David Poole
Publisher:David Poole
Chapter7: Distance And Approximation
Section7.3: Least Squares Approximation
Problem 31EQ

Related questions
Question
answer blank
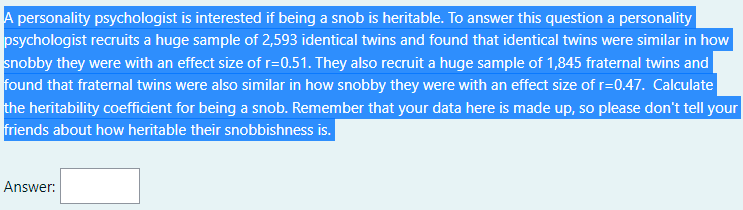
Transcribed Image Text:A personality psychologist is interested if being a snob is heritable. To answer this question a personality
psychologist recruits a huge sample of 2,593 identical twins and found that identical twins were similar in how
snobby they were with an effect size of r=0.51. They also recruit a huge sample of 1,845 fraternal twins and
found that fraternal twins were also similar in how snobby they were with an effect size of r=0.47. Calculate
the heritability coefficient for being a snob. Remember that your data here is made up, so please don't tell your
friends about how heritable their snobbishness is.
Answer:
Expert Solution
This question has been solved!
Explore an expertly crafted, step-by-step solution for a thorough understanding of key concepts.

Step by step
Solved in 2 steps with 2 images

Recommended textbooks for you
Linear Algebra: A Modern Introduction
Algebra
ISBN:
9781285463247
Author:
David Poole
Publisher:
Cengage Learning

Glencoe Algebra 1, Student Edition, 9780079039897…
Algebra
ISBN:
9780079039897
Author:
Carter
Publisher:
McGraw Hill
Linear Algebra: A Modern Introduction
Algebra
ISBN:
9781285463247
Author:
David Poole
Publisher:
Cengage Learning
Glencoe Algebra 1, Student Edition, 9780079039897…
Algebra
ISBN:
9780079039897
Author:
Carter
Publisher:
McGraw Hill