A politician selects a random sample of 306 voters from her state. For each voter, she records the region in which they live and their political affiliation. She Which of the following are the values of the chi-square statistic and P-value? Find the chi-square table here. would like to know if there is convincing evidence that the region in which voters live is associated with their political affiliation. Let a = 0.05. The observed and 0.07, P-value > 0.25 O 3.74, P-value > 0.10 expected counts are displayed in the tables. 4.04, P-value < 0.10 Observed counts: O 7.78, P-value < 0.05 Party Democratic Republican East 56 39 Region Center 51 58 West 40 62 Expected counts:
A politician selects a random sample of 306 voters from her state. For each voter, she records the region in which they live and their political affiliation. She Which of the following are the values of the chi-square statistic and P-value? Find the chi-square table here. would like to know if there is convincing evidence that the region in which voters live is associated with their political affiliation. Let a = 0.05. The observed and 0.07, P-value > 0.25 O 3.74, P-value > 0.10 expected counts are displayed in the tables. 4.04, P-value < 0.10 Observed counts: O 7.78, P-value < 0.05 Party Democratic Republican East 56 39 Region Center 51 58 West 40 62 Expected counts:

Holt Mcdougal Larson Pre-algebra: Student Edition 2012
1st Edition
ISBN:9780547587776
Author:HOLT MCDOUGAL
Publisher:HOLT MCDOUGAL
Chapter11: Data Analysis And Probability
Section: Chapter Questions
Problem 8CR

Related questions
Question
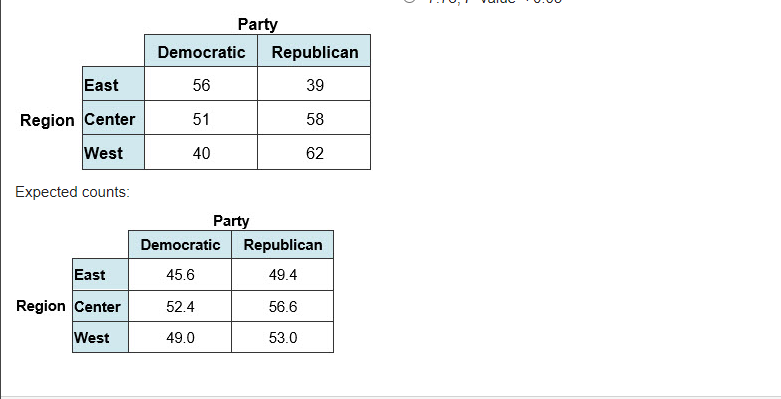
Transcribed Image Text:Party
Democratic
Republican
East
56
39
Region Center
51
58
West
40
62
Expected counts:
Party
Democratic
Republican
East
45.6
49.4
Region Center
52.4
56.6
West
49.0
53.0
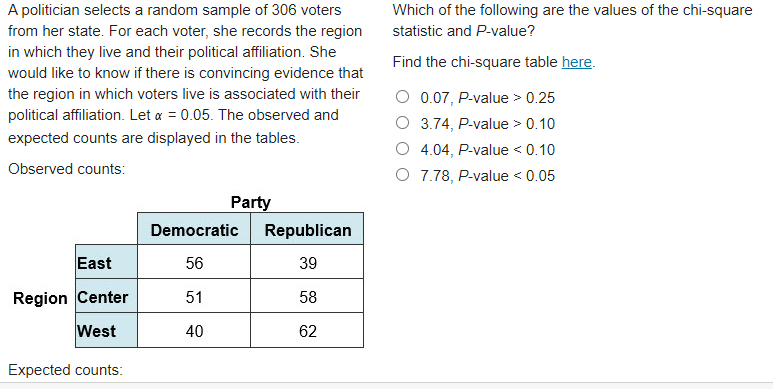
Transcribed Image Text:A politician selects a random sample of 306 voters
from her state. For each voter, she records the region
in which they live and their political affiliation. She
Which of the following are the values of the chi-square
statistic and P-value?
Find the chi-square table here.
would like to know if there is convincing evidence that
the region in which voters live is associated with their
political affiliation. Let a = 0.05. The observed and
0.07, P-value > 0.25
O 3.74, P-value > 0.10
expected counts are displayed in the tables.
4.04, P-value < 0.10
Observed counts:
O 7.78, P-value < 0.05
Party
Democratic Republican
East
56
39
Region Center
51
58
West
40
62
Expected counts:
Expert Solution
This question has been solved!
Explore an expertly crafted, step-by-step solution for a thorough understanding of key concepts.

This is a popular solution!

Trending now
This is a popular solution!

Step by step
Solved in 3 steps

Recommended textbooks for you
Holt Mcdougal Larson Pre-algebra: Student Edition…
Algebra
ISBN:
9780547587776
Author:
HOLT MCDOUGAL
Publisher:
HOLT MCDOUGAL

Glencoe Algebra 1, Student Edition, 9780079039897…
Algebra
ISBN:
9780079039897
Author:
Carter
Publisher:
McGraw Hill
Holt Mcdougal Larson Pre-algebra: Student Edition…
Algebra
ISBN:
9780547587776
Author:
HOLT MCDOUGAL
Publisher:
HOLT MCDOUGAL
Glencoe Algebra 1, Student Edition, 9780079039897…
Algebra
ISBN:
9780079039897
Author:
Carter
Publisher:
McGraw Hill