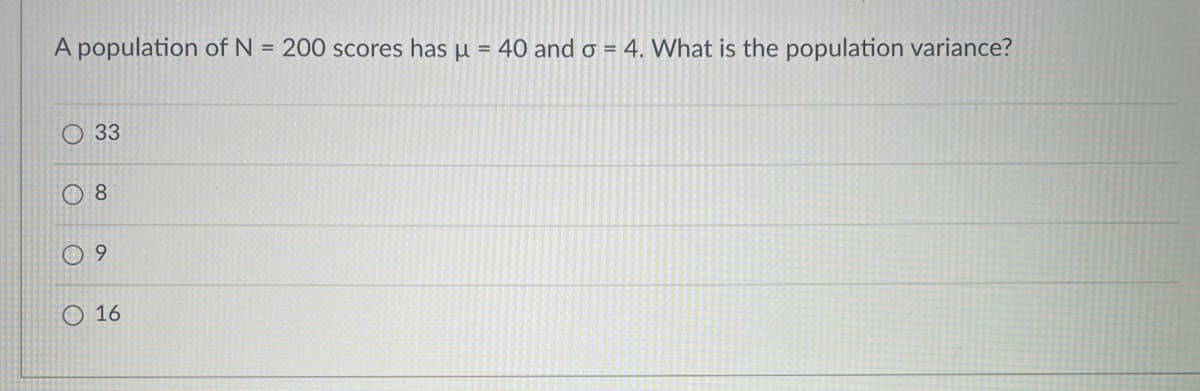
A population of N = 200 scores has u = 40 and o = 4. What is the population variance? O 33 O 8 0 9 O 16


Q: If the population mean and variance are 154 and 36 respectively, then the sample size that makes a…
A: Population mean = 154Variance = 36Standard error of the sample mean = 0.50
Q: Given a normally distributed population with a mean of 100 and variance 100, find ) P(90 sxs 115) 9)…
A: As per our company guidelines we are supposed to answer only first 3 sub-parts. Kindly repost other…
Q: Given a normally distributed population with mear '5 and variance 625, find: . Р(50 90) ii. P(X <…
A: The standard deviation is: σ=σ2=625=25 i Given: μ=75, σ=25 The corresponding z-values needed to be…
Q: A population of grades for a statistics class of six students is given below: 80 74 65 84 85 70…
A: From the provided information, The population data is as follow: 80, 74, 65, 84, 85, 70
Q: If the correlation coefficient between variables is .60, how much of the variance is unexplained by…
A:
Q: If an analysis of variance is used for the following data, what would be the effect of changing the…
A: The given sample data is as follows: M1 = 10, M2 = 20, SS1 = 90, and SS2 = 70. The value of M2 is…
Q: Using the sample data in Table 1 above, determine the standard deviation of the daily consumption of…
A: The question is about grouped freq. dist. Given :
Q: The following table shows the results of an analysis of variance comparing three treatments. What is…
A: Given that the table shows the results of an analysis of variance comparing three treatments.
Q: If a sample of 25 students is taken from a population of 179 students, the population variance, o,…
A:
Q: If a student scored 70 points on a test where the mean was 66 and the student's z-score was 0.42,…
A:
Q: Based on the regression output, approximately what % of the variance is explained by the regression…
A: Given Multiple R = 0.8299 R square = 0.7511 Adjusted R square = 0.7015 Standard Error = 65.3355…
Q: A survey was conducted to find the number of cars each household owns in a particular subdivision.…
A: Answer: Option A. 0.89.
Q: A population of grades for a statistics class of six students is given below: 90 65 70 85 86 70 Find…
A: given data : 90,65,70,85,86,70
Q: In the data set below, what is the variance? 3 7 2 8 5 9 1 If the answer is a decimal, round it to…
A: Given data (3,7,2,8,8,9,1) n=7
Q: fou randomly sample 100 FIU students and collect data on the number of coffee drinks consumed per…
A: Given that, Random sample of 100 FIU students and data on the number of coffee drinks consumed per…
Q: b) The following table gives the values of mean and variance of heights and weights of the 10th…
A: Mean and variance of the heights and weights of the 10th standard of a school are given.
Q: For a population that is normally distributed with a very large population size compared to the…
A: The sampling distribution of sample mean follows normal distribution with mean, μx=μ and standard…
Q: Complete the table below for the Eastern Conference and find the variance σ2, and the standard…
A: Given - Two tables for western and eastern conference
Q: If the deviations six of values from their mean are 0, -6, 7,-2,5,-4 then the sample variance equal…
A:
Q: Here is a POPULATION of scores: 4 2 3 2 1 29. What is the variance for this population of scores?…
A:
Q: The weights (in pounds) of a sample of 36 individuals were recorded and the following statistics…
A:
Q: Suppose you have the hemoglobin level for 15 children. Based on the values provided, find the…
A:
Q: The ages (in years) of a random sample of shoppers at a gaming store are given below: 12 21 23 15 20…
A: Observation: XX X^2X2 1 12 144 2 21 441 3 23 529 4 15 225 5 20 400 6 16 256 7 19 361…
Q: A sample of n =25 means has a variance of 36. What is the standard error for the sample means?…
A: Sample size, n = 25 Variance = 36 We know that, Standard deviation = VarianceStandard deviation…
Q: Two samples of scores on a survey are as follows: Sample A: 10 7 6 8| 7 19 Sample B: 18310 112 7 25.…
A:
Q: If an analysis of variance is used for the following data, what would be the effect of changing the…
A: F-ratio is interpreted as the ratio of mean sum of squares between and mean sum of squares within.…
Q: Discuss the Skewness and Kurtosis and find the mean and the variance for the following ungrouped…
A: From the given information we want to find skewness, kurtosis and mean variance.
Q: If the coefficient of variation = 10% and the mean = 1000, then the %3D %3D variance is O a. 1000 O…
A:
Q: 5. Compute the Variance on the data below Test Scores X-X bar (X-X) bar squared Xi 58 61 64 71 79 81…
A:
Q: Variance, and he data. e?
A: Given : The Highway Patrol, using radar, checked the speeds (in mph) of 30 passing motorists at a…
Q: The heights in cm of a group of first year biology students were recorded. The variance of these…
A:
Q: Some computer output for an analysis of variance test to compare means is given. Source Groups Error…
A: a) Number of groups in the given study: df for Groups=4 Number of groups-1=4 Number of groups=4+1=5…
Q: Find the coefficient of variation (CV) of the following data using sample variance. Use 3 decimal…
A:
Q: From the community hospital and clinics around a city, the ages of dentists, nurses and physicians…
A:
Q: If an analysis of variance is used for the following data, what would be the effect of changing the…
A: The formula for sum of square between is, SSbetween=∑iMi-M¯2 When the value of M2 is increased from…
Q: Find the coefficient of variation (CV) of the following data using sample variance. Use 3 decimal…
A:
Q: Histogram: fines paid by drivers 12 10 4. 1 2 3 More Number of fines paid a year by a driver Compute…
A:
Q: Assume that you want to test the claim that the paired sample data from a for which the mean…
A: The following information has been provided: X Y Difference = Sample 1 - Sample 2 11 8 3…
Q: Find the first and third quartile for the data shown 5.3 7.6 8.2 10.4 11.7 13 16 27.4 28.3 29.6 Q1 =…
A: Given data: 5.37.68.210.411.7131627.428.329.6
Q: Student 12 3 4 5 6 7 8 Score 66 59 70 83 82 73 85 74 Find the mean Ju and variance S2 of the…
A: Student 1 2 3 4 5 6 7 8 Score 66 59 7 83 82 73 85 74
Q: A plant pathologist wants to compare two strains of bacteria in terms of its reproduction rate. Test…
A: Here we have to test a plant pathologist wants to compare two strains of bacteria in terms of its…
Q: 13. According to a recent random sample of 31 Canadiar Football League players, the mean agé was…
A:
Q: Given mean = 50, median = 48 and coefficient of skewness = 1. Find the value of the variance
A: A measure of central tendency is a single value that attempts to describe a set of data by…
Q: For a population that is normally distributed with a very large population size compared to the…
A: From the given information, let X be a random variable which follows normal distribution with mean…
Q: Find the first and third quartile for the data shown 4.5 4.9 7.2 9 9.9 11.2 13.3 17.6 17.9 25.6 Q1 =…
A:
Q: We are interested in determining whether or not the variances of the sales at two music stores (A…
A:
Q: Let X-1: correct, X=0 : wrong And P= Pr(X=1)=2/5 What is the variance? 32 O.6 O.4
A: The Poisson distribution is the discrete probability distribution of the number of events occurring…
Q: The following table shows the results of an analysis of variance comparing three treatment…
A: From the provided information, Source SS df MS Between 30 2 15 F=7.50…
Q: State whether the effect size for a 1-point effect (M- = 1) is small, medium or large given the…
A: Effect size is: Effect size=M-μσ=1σ
Q: o the population variance
A: Generally, we obtain the variance based on the sample data but if in the problem there is mention…

Trending now
This is a popular solution!

Step by step
Solved in 2 steps with 2 images
