A population of parasitic insects has infected the trees in local wooded areas. In a specific plot of land, the number of infected trees seems to be growing exponentially. On January 1st of 2020, 112 infected trees are observed, and on March 1st of 2022, there are 145 infected trees. Use 4 significant figures in your calculations and answers. (a) Construct an exponential model of the number of infected trees N(t) where t is measured in years and t = 0 represents January 1st of 2020. You may assume in your calculations that each month is exactly 1/12 of a year. (b) Sketch a graph of your model between January 1st 2020 and January 1st 2030. Sketch the graph by plotting 6 points and then connecting them smoothly; use the 1st of January 2020, March 2022 and January 2030, along with 3 other dates chosen in the range. Include labeled axes, label the curve with the formula, and choose the scale of your graph carefully; the entire domain and range must be included with a minimal amount of wasted space. You may use the grid provided on the next page, or your own graph paper. Use a ruler for both the graph and the table of values. (c) How many years (after January 1st 2020) will it take the population to reach 2000?
A population of parasitic insects has infected the trees in local wooded areas. In a specific plot of land, the number of infected trees seems to be growing exponentially. On January 1st of 2020, 112 infected trees are observed, and on March 1st of 2022, there are 145 infected trees. Use 4 significant figures in your calculations and answers. (a) Construct an exponential model of the number of infected trees N(t) where t is measured in years and t = 0 represents January 1st of 2020. You may assume in your calculations that each month is exactly 1/12 of a year. (b) Sketch a graph of your model between January 1st 2020 and January 1st 2030. Sketch the graph by plotting 6 points and then connecting them smoothly; use the 1st of January 2020, March 2022 and January 2030, along with 3 other dates chosen in the range. Include labeled axes, label the curve with the formula, and choose the scale of your graph carefully; the entire domain and range must be included with a minimal amount of wasted space. You may use the grid provided on the next page, or your own graph paper. Use a ruler for both the graph and the table of values. (c) How many years (after January 1st 2020) will it take the population to reach 2000?

Chapter5: Exponential And Logarithmic Functions
Section5.5: Exponential And Logarithmic Models
Problem 30E: The table shows the mid-year populations (in millions) of five countries in 2015 and the projected...

Related questions
Question
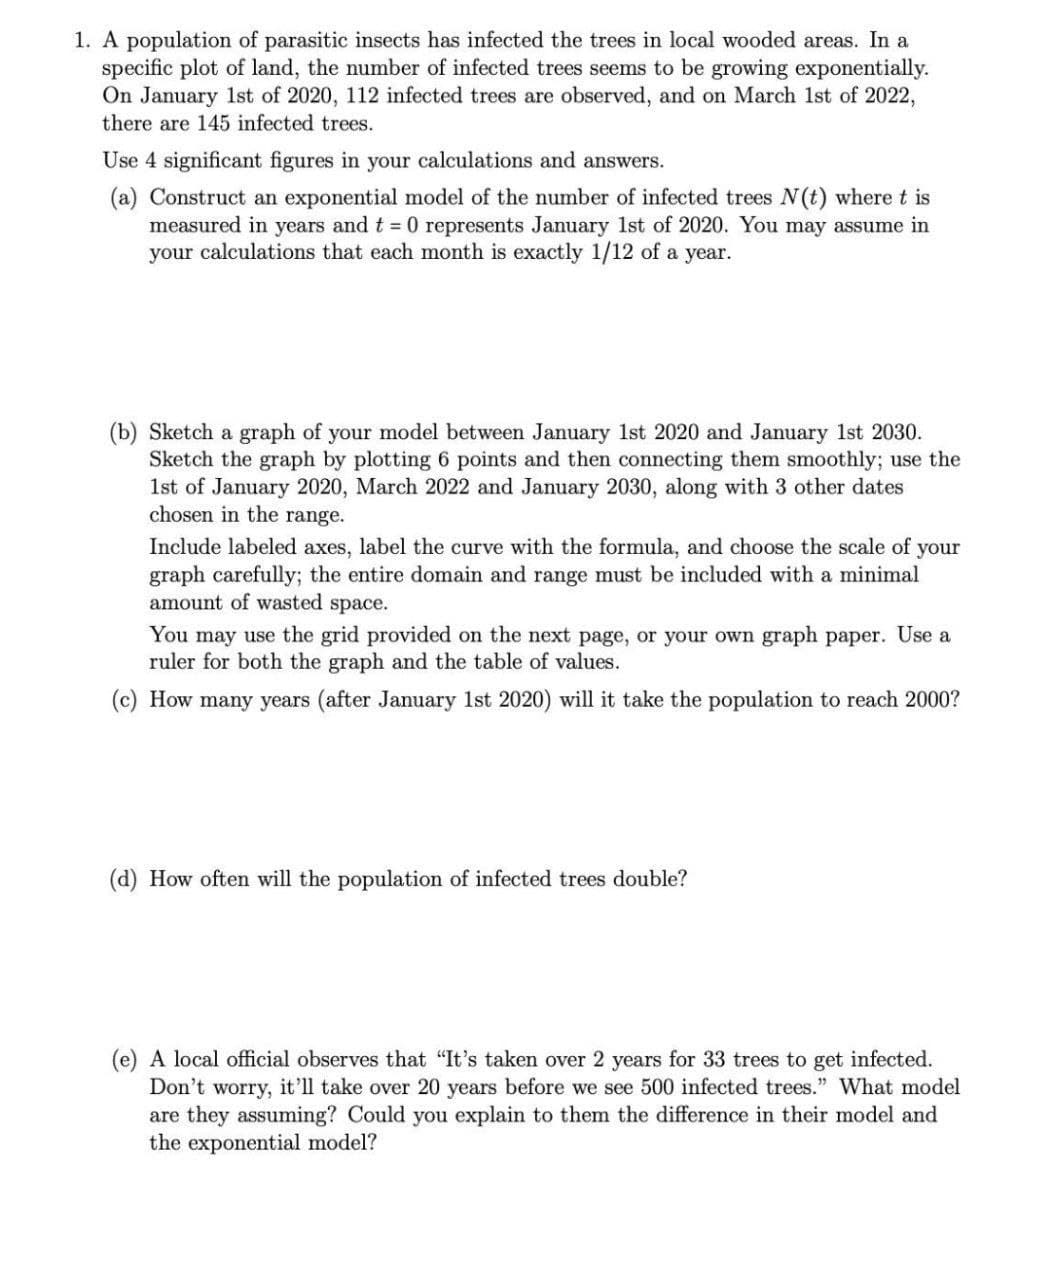
Transcribed Image Text:1. A population of parasitic insects has infected the trees in local wooded areas. In a
specific plot of land, the number of infected trees seems to be growing exponentially.
On January 1st of 2020, 112 infected trees are observed, and on March 1st of 2022,
there are 145 infected trees.
Use 4 significant figures in your calculations and answers.
(a) Construct an exponential model of the number of infected trees N(t) where t is
measured in years and t = 0 represents January 1st of 2020. You may assume in
your calculations that each month is exactly 1/12 of a year.
(b) Sketch a graph of your model between January 1st 2020 and January 1st 2030.
Sketch the graph by plotting 6 points and then connecting them smoothly; use the
1st of January 2020, March 2022 and January 2030, along with 3 other dates
chosen in the range.
Include labeled axes, label the curve with the formula, and choose the scale of your
graph carefully; the entire domain and range must be included with a minimal
amount of wasted space.
You may use the grid provided on the next page, or your own graph paper. Use a
ruler for both the graph and the table of values.
(c) How many years (after January 1st 2020) will it take the population to reach 2000?
(d) How often will the population of infected trees double?
(e) A local official observes that "It's taken over 2 years for 33 trees to get infected.
Don't worry, it'll take over 20 years before we see 500 infected trees." What model
are they assuming? Could you explain to them the difference in their model and
the exponential model?
Expert Solution
This question has been solved!
Explore an expertly crafted, step-by-step solution for a thorough understanding of key concepts.

Step by step
Solved in 4 steps with 1 images

Recommended textbooks for you

Linear Algebra: A Modern Introduction
Algebra
ISBN:
9781285463247
Author:
David Poole
Publisher:
Cengage Learning

Algebra & Trigonometry with Analytic Geometry
Algebra
ISBN:
9781133382119
Author:
Swokowski
Publisher:
Cengage
Linear Algebra: A Modern Introduction
Algebra
ISBN:
9781285463247
Author:
David Poole
Publisher:
Cengage Learning
Algebra & Trigonometry with Analytic Geometry
Algebra
ISBN:
9781133382119
Author:
Swokowski
Publisher:
Cengage

College Algebra (MindTap Course List)
Algebra
ISBN:
9781305652231
Author:
R. David Gustafson, Jeff Hughes
Publisher:
Cengage Learning

College Algebra
Algebra
ISBN:
9781305115545
Author:
James Stewart, Lothar Redlin, Saleem Watson
Publisher:
Cengage Learning

Algebra and Trigonometry (MindTap Course List)
Algebra
ISBN:
9781305071742
Author:
James Stewart, Lothar Redlin, Saleem Watson
Publisher:
Cengage Learning