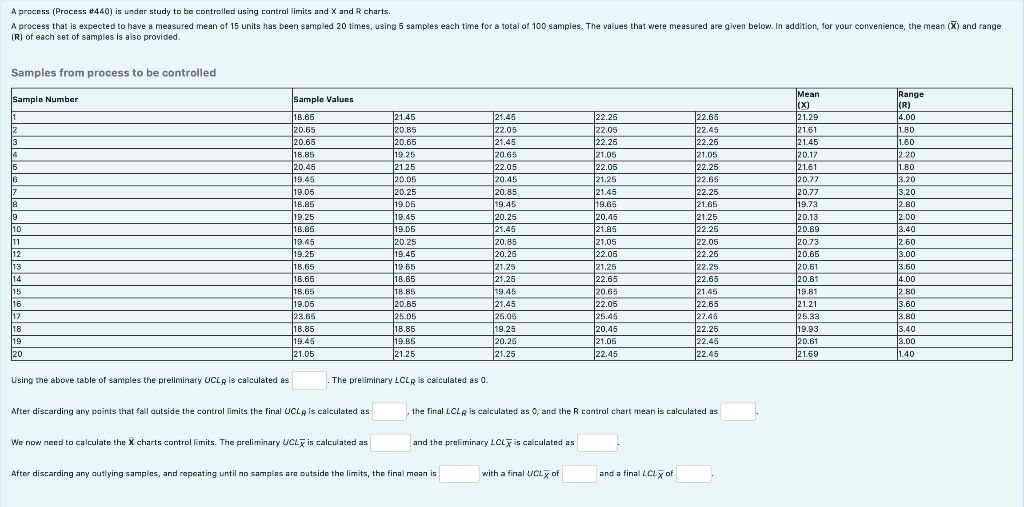
A process (Process #440) is under study to be controlled using control limits and X and R charts. A process that is expected to have a measured mean of 15 units has been sampled 20 times, using 5 samples each time for a total of 100 samples. The values that were measured are given below. In addition, for your convenience, the mean (X) and range (R) of each set of samples is also provided. Samples from process to be controlled Range Sample Number Sample Values Mean (x) (R) 1 18.65 21.45 21.45 22.25 22.65 21.29 14.00 20.65 2 20.85 22.05 22.05 22.45 21.61 1.80 20.65 20.65 21.45 22.25 22.25 21.45 1.60 18.85 19.25 20.65 21.05 21.05 20.17 2.20 20.45 21.25 22.05 22.05 22.25 21.61 1.80 19.45 20.05 20.45 21.25 22.65 20.77 3.20 19.05 20.25 20.85 21.45 22.25 20.77 3.20 18.85 19.05 19.45 19.65 21.65 19.73 2.80 9 19.25 19.45 20.25 20.45 21.25 20.13 2.00 10 18.85 19.05 21.45 21.85 22.25 20.69 3.40 11 19.45 20.25 20.85 21.05 22.05 20.73 2.60 12 19.25 19.45 20.25 22.05 22.25 20.65 3.00 13 18.65 19.65 21.25 21.25 22.25 20.61 3.60 14 18.65 18.85 21.25 22.65 22.65 20.81 14.00 15 18.65 18.85 19.45 20.65 21.45 19.81 2.80 16 19.05 20.85 121.45 22.05 22.65 21.21 3.60 17 23.65 25.05 25.05 25.45 27.45 25.33 3.80 18 18.85 18.85 19.25 20.45 22.25 19.93 3.40 19 19.45 19.85 20.25 21.05 22.45 13.00 120.61 20 21.05 21.25 21.25 22.45 22.45 21.69 1.40 Using the above table of samples the preliminary UCL is calculated as The preliminary LCLR is calculated as 0. After discarding any points that fall outside the control limits the final UCL is calculated as the final LCLR is calculated as 0, and the R control chart mean is calculated as and the preliminary LCL is calculated as We now need to calculate the X charts control limits. The preliminary UCL is calculated as After discarding any outlying samples, and repeating until no samples are outside the limits, the final mean is with a final UCLX of and a final LCL of 3 4 5 6 7 18
A process (Process #440) is under study to be controlled using control limits and X and R charts. A process that is expected to have a measured mean of 15 units has been sampled 20 times, using 5 samples each time for a total of 100 samples. The values that were measured are given below. In addition, for your convenience, the mean (X) and range (R) of each set of samples is also provided. Samples from process to be controlled Range Sample Number Sample Values Mean (x) (R) 1 18.65 21.45 21.45 22.25 22.65 21.29 14.00 20.65 2 20.85 22.05 22.05 22.45 21.61 1.80 20.65 20.65 21.45 22.25 22.25 21.45 1.60 18.85 19.25 20.65 21.05 21.05 20.17 2.20 20.45 21.25 22.05 22.05 22.25 21.61 1.80 19.45 20.05 20.45 21.25 22.65 20.77 3.20 19.05 20.25 20.85 21.45 22.25 20.77 3.20 18.85 19.05 19.45 19.65 21.65 19.73 2.80 9 19.25 19.45 20.25 20.45 21.25 20.13 2.00 10 18.85 19.05 21.45 21.85 22.25 20.69 3.40 11 19.45 20.25 20.85 21.05 22.05 20.73 2.60 12 19.25 19.45 20.25 22.05 22.25 20.65 3.00 13 18.65 19.65 21.25 21.25 22.25 20.61 3.60 14 18.65 18.85 21.25 22.65 22.65 20.81 14.00 15 18.65 18.85 19.45 20.65 21.45 19.81 2.80 16 19.05 20.85 121.45 22.05 22.65 21.21 3.60 17 23.65 25.05 25.05 25.45 27.45 25.33 3.80 18 18.85 18.85 19.25 20.45 22.25 19.93 3.40 19 19.45 19.85 20.25 21.05 22.45 13.00 120.61 20 21.05 21.25 21.25 22.45 22.45 21.69 1.40 Using the above table of samples the preliminary UCL is calculated as The preliminary LCLR is calculated as 0. After discarding any points that fall outside the control limits the final UCL is calculated as the final LCLR is calculated as 0, and the R control chart mean is calculated as and the preliminary LCL is calculated as We now need to calculate the X charts control limits. The preliminary UCL is calculated as After discarding any outlying samples, and repeating until no samples are outside the limits, the final mean is with a final UCLX of and a final LCL of 3 4 5 6 7 18

Glencoe Algebra 1, Student Edition, 9780079039897, 0079039898, 2018
18th Edition
ISBN:9780079039897
Author:Carter
Publisher:Carter
Chapter4: Equations Of Linear Functions
Section4.5: Correlation And Causation
Problem 2AGP

Related questions
Question
Transcribed Image Text:A process (Process #440) is under study to be controlled using control limits and X and R charts.
A process that is expected to have a measured mean of 15 units has been sampled 20 times, using 5 samples each time for a total of 100 samples. The values that were measured are given below. In addition, for your convenience, the mean (X) and range
(R) of each set of samples is also provided.
Samples from process to be controlled
Mean
Range
Sample Number
Sample Values
(X)
(R)
11
18.66
21.45
21.45
22.26
22.65
21.29
4.00
20.65
20.85
22.05
22.05
22.45
21.61
1.80
20.65
20.65
21.45
22.25
22.25
21.45
1.60
18.85
19.25
20.65
21.05
21.05
20.17
2.20
20.45
21.25
22.05
22.05
22.25
21.61
1.80
19.45
20.05
20.45
21.25
22.65
20.77
3.20
19.05
20.25
20.85
21.45
22.25
20.77
3.20
18.85
19.05
19.45
19.65
21.65
19.73
2.80
19.25
19.45
20.25
20.45
21.25
20.13
2.00
10
18.86
19.05
21.45
21.85
22.26
20.69
3.40
11
19.45
20.25
20.85
21.05
22.05
20.73
2.60
12
19.25
19.45
20.25
22.06
22.25
20.65
3.00
13
18.65
19.65
21.25
21.25
22.25
20.61
3.60
14
18.65
18.685
21.25
22.65
22.65
20.81
4.00
15
18.65
18.85
19.45
20.65
21.45
19.81
2.80
16
19.05
20.85
21.45
22.05
22.65
21.21
3.60
17
23.65
25.05
25.05
25.45
27.45
125.33
3.80
18
18.85
18.85
19.25
20.45
22.25
19.93
3.40
19
19.45
19.85
121.05
22.45
120.61
3.00
20.25
21.25
20
21.05
21.25
22.45
22.45
21.69
1.40
Using the above table of samples the preliminary UCLA is calculated as
The preliminary LCLR is calculated as 0.
After discarding any points that fall outside the control limits the final UCLA is calculated as
, the final LCLR is calculated as 0, and the R control chart mean is calculated as
and the preliminary LCLX is calculated as
We now need to calculate the X charts control limits. The preliminary UCLX is calculated as
After discarding any outlying samples, and repeating until no samples are outside the limits, the final mean is
with a final UCLX of
and a final LCLX of
2
13
4
5
6
7
8
19
Expert Solution
This question has been solved!
Explore an expertly crafted, step-by-step solution for a thorough understanding of key concepts.

Step by step
Solved in 3 steps with 3 images

Recommended textbooks for you
Glencoe Algebra 1, Student Edition, 9780079039897…
Algebra
ISBN:
9780079039897
Author:
Carter
Publisher:
McGraw Hill
Glencoe Algebra 1, Student Edition, 9780079039897…
Algebra
ISBN:
9780079039897
Author:
Carter
Publisher:
McGraw Hill