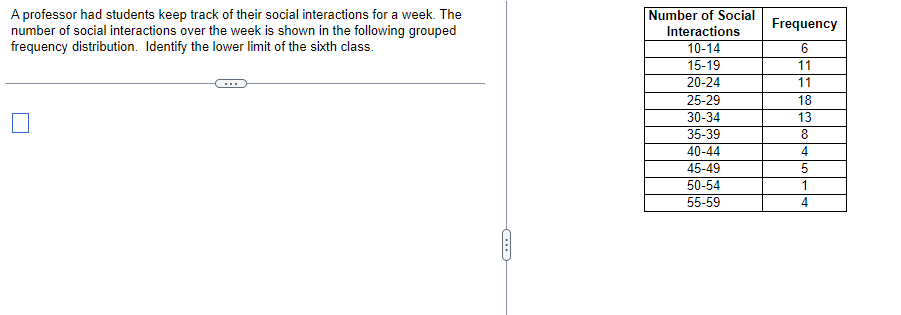
A professor had students keep track of their social interactions for a week. The number of social interactions over the week is shown in the following grouped frequency distribution. Identify the lower limit of the sixth class. Number of Social Interactions 10-14 15-19 20-24 25-29 30-34 35-39 40-44 45-49 50-54 55-59 Frequency 6 11 11 18 13 8 4 5 1 4
A professor had students keep track of their social interactions for a week. The number of social interactions over the week is shown in the following grouped frequency distribution. Identify the lower limit of the sixth class. Number of Social Interactions 10-14 15-19 20-24 25-29 30-34 35-39 40-44 45-49 50-54 55-59 Frequency 6 11 11 18 13 8 4 5 1 4

Glencoe Algebra 1, Student Edition, 9780079039897, 0079039898, 2018
18th Edition
ISBN:9780079039897
Author:Carter
Publisher:Carter
Chapter10: Statistics
Section10.4: Distributions Of Data
Problem 19PFA

Related questions
Question
Transcribed Image Text:A professor had students keep track of their social interactions for a week. The
number of social interactions over the week is shown in the following grouped
frequency distribution. Identify the lower limit of the sixth class.
Number of Social
Interactions
10-14
15-19
20-24
25-29
30-34
35-39
40-44
45-49
50-54
55-59
Frequency
6
11
11
18
13
8
4
5
1
4
Expert Solution
This question has been solved!
Explore an expertly crafted, step-by-step solution for a thorough understanding of key concepts.

This is a popular solution!

Trending now
This is a popular solution!

Step by step
Solved in 2 steps

Recommended textbooks for you
Glencoe Algebra 1, Student Edition, 9780079039897…
Algebra
ISBN:
9780079039897
Author:
Carter
Publisher:
McGraw Hill
Glencoe Algebra 1, Student Edition, 9780079039897…
Algebra
ISBN:
9780079039897
Author:
Carter
Publisher:
McGraw Hill