A random group of students was asked to name their favorite type of music. The campus radio station believes that 16% of the students prefer rap, 26% prefer rock, 15% prefer country, 11% prefer new age, and 32% prefer oldies. Is there evidence to reject this hypothesis at a = 0.05? Type of music Rap Rock Country New Age Oldies Number of Students 24 29 18 20 18 A) There is not evidence to reject the claim that the favorite music types are distributed as claimed because the test value 9.488 < 16.170 B) There is evidence to reject the claim that the favorite music types are distributed as claimed because the test value 16.170 > 9.488 C) There is not evidence to reject the claim that the favorite music types are distributed as claimed because the test value 11.070 < 16.170 D) There is evidence to reject the claim that the favorite music types are distributed as claimed because the test value 16.170 > 7.815
A random group of students was asked to name their favorite type of music. The campus radio station believes that 16% of the students prefer rap, 26% prefer rock, 15% prefer country, 11% prefer new age, and 32% prefer oldies. Is there evidence to reject this hypothesis at a = 0.05? Type of music Rap Rock Country New Age Oldies Number of Students 24 29 18 20 18 A) There is not evidence to reject the claim that the favorite music types are distributed as claimed because the test value 9.488 < 16.170 B) There is evidence to reject the claim that the favorite music types are distributed as claimed because the test value 16.170 > 9.488 C) There is not evidence to reject the claim that the favorite music types are distributed as claimed because the test value 11.070 < 16.170 D) There is evidence to reject the claim that the favorite music types are distributed as claimed because the test value 16.170 > 7.815

Algebra & Trigonometry with Analytic Geometry
13th Edition
ISBN:9781133382119
Author:Swokowski
Publisher:Swokowski
Chapter10: Sequences, Series, And Probability
Section10.8: Probability
Problem 32E

Related questions

Topic Video
Question
100%
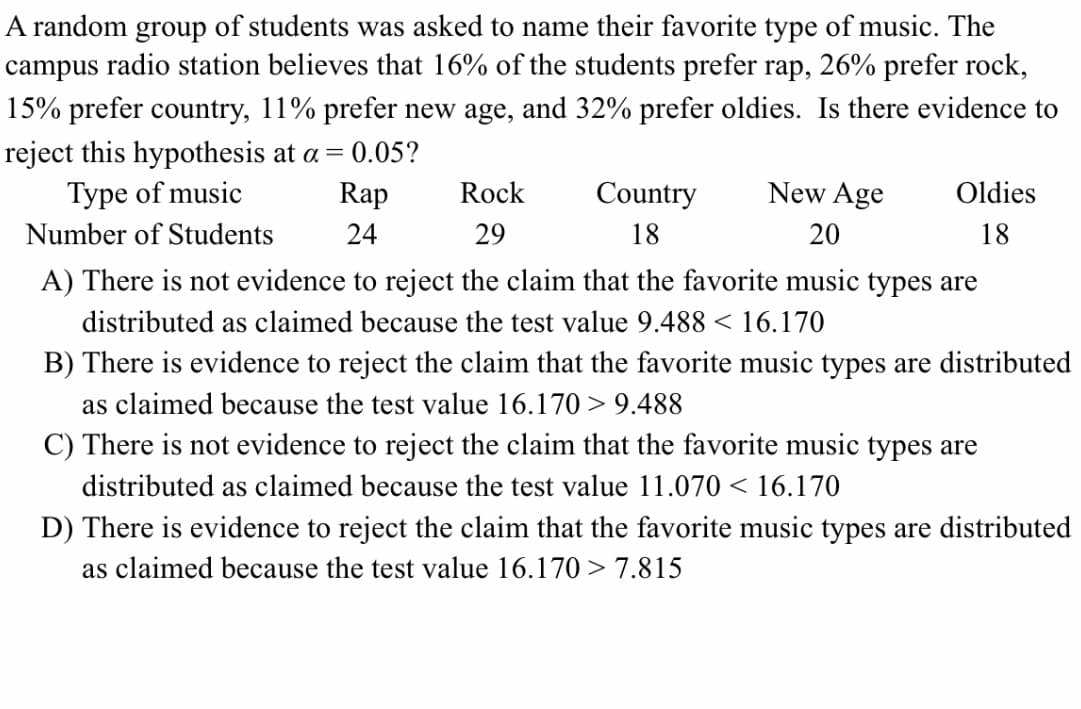
Transcribed Image Text:A random group of students was asked to name their favorite type of music. The
campus radio station believes that 16% of the students prefer rap, 26% prefer rock,
15% prefer country, 11% prefer new age, and 32% prefer oldies. Is there evidence to
reject this hypothesis at a = 0.05?
Type of music
Rap
Rock
Country
New Age
Oldies
Number of Students
24
29
18
20
18
A) There is not evidence to reject the claim that the favorite music types are
distributed as claimed because the test value 9.488 < 16.170
B) There is evidence to reject the claim that the favorite music types are distributed
as claimed because the test value 16.170 > 9.488
C) There is not evidence to reject the claim that the favorite music types are
distributed as claimed because the test value 11.070 < 16.170
D) There is evidence to reject the claim that the favorite music types are distributed
as claimed because the test value 16.170 > 7.815
Expert Solution
This question has been solved!
Explore an expertly crafted, step-by-step solution for a thorough understanding of key concepts.

This is a popular solution!

Trending now
This is a popular solution!

Step by step
Solved in 2 steps with 3 images

Knowledge Booster


Learn more about
Need a deep-dive on the concept behind this application? Look no further. Learn more about this topic, statistics and related others by exploring similar questions and additional content below.Recommended textbooks for you
Algebra & Trigonometry with Analytic Geometry
Algebra
ISBN:
9781133382119
Author:
Swokowski
Publisher:
Cengage

Holt Mcdougal Larson Pre-algebra: Student Edition…
Algebra
ISBN:
9780547587776
Author:
HOLT MCDOUGAL
Publisher:
HOLT MCDOUGAL
Algebra & Trigonometry with Analytic Geometry
Algebra
ISBN:
9781133382119
Author:
Swokowski
Publisher:
Cengage
Holt Mcdougal Larson Pre-algebra: Student Edition…
Algebra
ISBN:
9780547587776
Author:
HOLT MCDOUGAL
Publisher:
HOLT MCDOUGAL