A random sample of 16 pharmacy customers showed the waiting times below (in minutes). 20 14 23 22 22 15 21 18 17 14 25 15 21 20 14 23 Click here for the Excel Data File Find a 90 percent confidence interval for u, assuming that the sample is from a normal population. (Round your standard deviation answer to 4 decimal places and t-value to 3 decimal places. Round your answers to 3 decimal places.) The 90% confidence interval to
A random sample of 16 pharmacy customers showed the waiting times below (in minutes). 20 14 23 22 22 15 21 18 17 14 25 15 21 20 14 23 Click here for the Excel Data File Find a 90 percent confidence interval for u, assuming that the sample is from a normal population. (Round your standard deviation answer to 4 decimal places and t-value to 3 decimal places. Round your answers to 3 decimal places.) The 90% confidence interval to

Big Ideas Math A Bridge To Success Algebra 1: Student Edition 2015
1st Edition
ISBN:9781680331141
Author:HOUGHTON MIFFLIN HARCOURT
Publisher:HOUGHTON MIFFLIN HARCOURT
Chapter4: Writing Linear Equations
Section: Chapter Questions
Problem 14CR

Related questions

Question
Transcribed Image Text:zto.mheducation.com/ext/map/index.html?_con3Dcon&external_browser%3D0&launchUrl=https%253A%252F%252Fnewconnect.mheducation.com%252F#
Не
Saved
mework: Chapter 8 (Sections 8.4 through 8.6) i
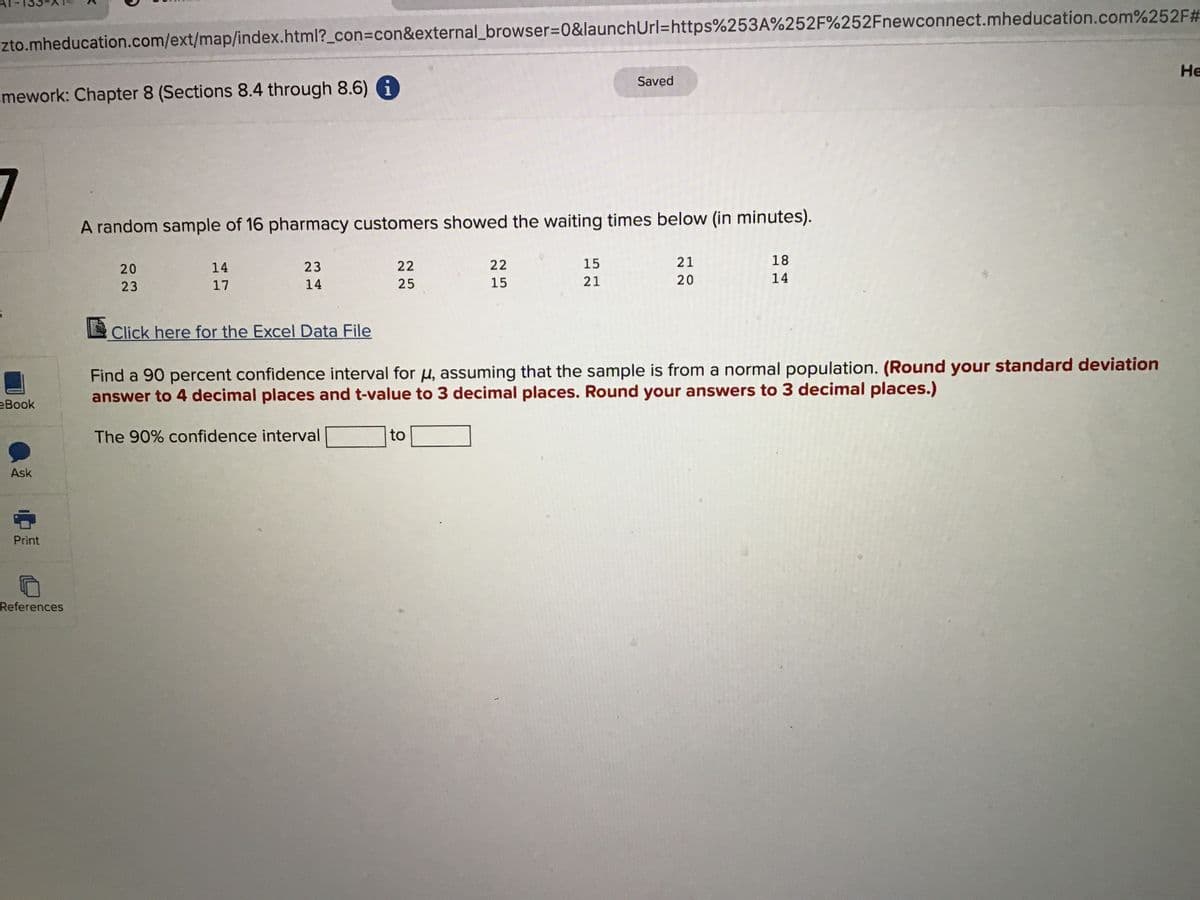
A random sample of 16 pharmacy customers showed the waiting times below (in minutes).
20
14
23
22
22
15
21
18
23
17
14
25
15
21
20
14
Click here for the Excel Data File
Find a 90 percent confidence interval for u, assuming that the sample is from a normal population. (Round your standard deviation
answer to 4 decimal places and t-value to 3 decimal places. Round your answers to 3 decimal places.)
еВook
The 90% confidence interval
to
Ask
Print
References
Expert Solution
This question has been solved!
Explore an expertly crafted, step-by-step solution for a thorough understanding of key concepts.

This is a popular solution!

Trending now
This is a popular solution!

Step by step
Solved in 2 steps

Knowledge Booster


Learn more about
Need a deep-dive on the concept behind this application? Look no further. Learn more about this topic, statistics and related others by exploring similar questions and additional content below.Recommended textbooks for you
Big Ideas Math A Bridge To Success Algebra 1: Stu…
Algebra
ISBN:
9781680331141
Author:
HOUGHTON MIFFLIN HARCOURT
Publisher:
Houghton Mifflin Harcourt

Holt Mcdougal Larson Pre-algebra: Student Edition…
Algebra
ISBN:
9780547587776
Author:
HOLT MCDOUGAL
Publisher:
HOLT MCDOUGAL
Big Ideas Math A Bridge To Success Algebra 1: Stu…
Algebra
ISBN:
9781680331141
Author:
HOUGHTON MIFFLIN HARCOURT
Publisher:
Houghton Mifflin Harcourt
Holt Mcdougal Larson Pre-algebra: Student Edition…
Algebra
ISBN:
9780547587776
Author:
HOLT MCDOUGAL
Publisher:
HOLT MCDOUGAL