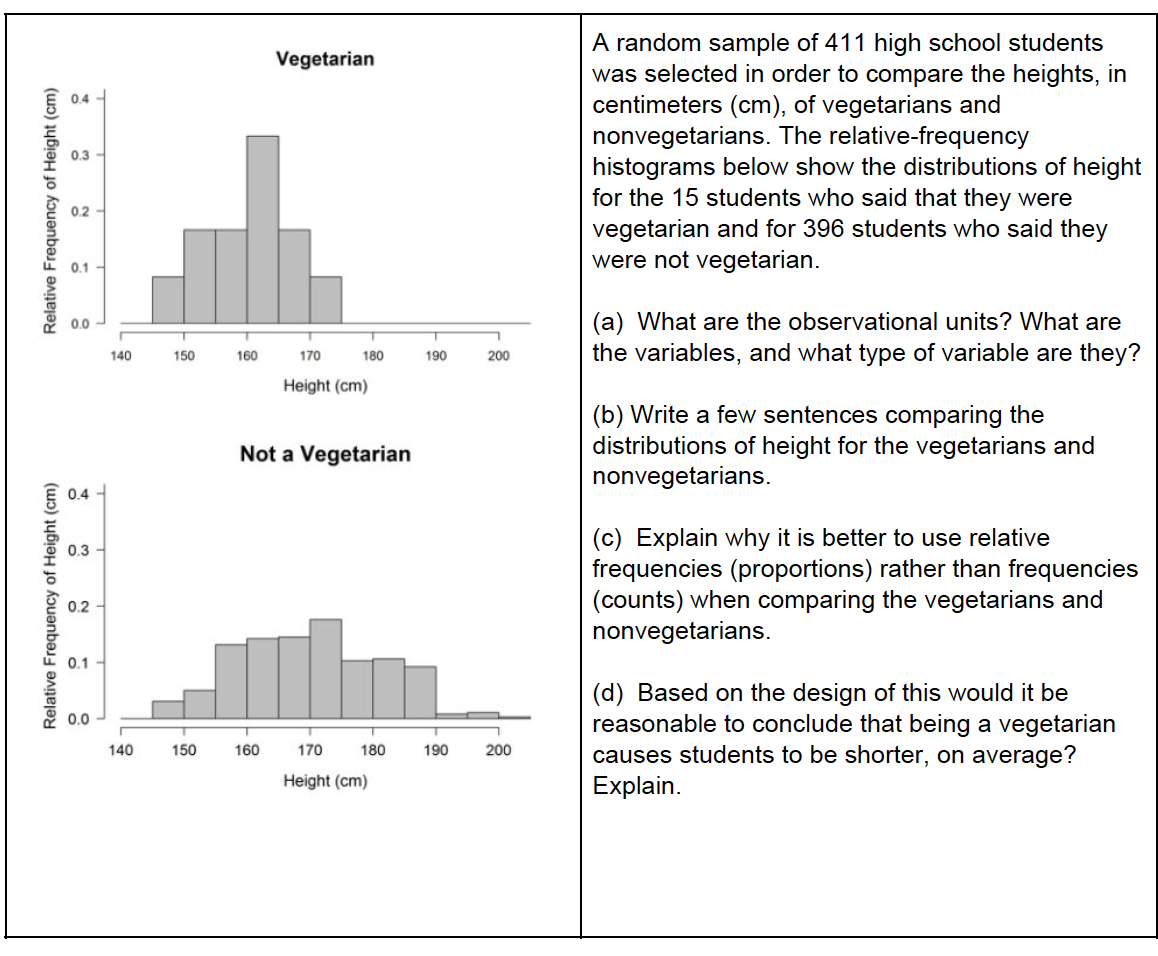
A random sample of 411 high school students was selected in order to compare the heights, in centimeters (cm), of vegetarians and nonvegetarians. The relative-frequency histograms below show the distributions of heigh for the 15 students who said that they were vegetarian and for 396 students who said they were not vegetarian. Vegetarian 0.4 0.3 0.2 0.1 - 0.0 (a) What are the observational units? What are the variables, and what type of variable are they 140 150 160 170 180 190 200 Height (cm) (b) Write a few sentences comparing the distributions of height for the vegetarians and nonvegetarians. Not a Vegetarian 0.4 (c) Explain why it is better to use relative frequencies (proportions) rather than frequencies (counts) when comparing the vegetarians and nonvegetarians. 0.3 0.2 equency of Height (cm) Relative Frequency of Height (cm)
A random sample of 411 high school students was selected in order to compare the heights, in centimeters (cm), of vegetarians and nonvegetarians. The relative-frequency histograms below show the distributions of heigh for the 15 students who said that they were vegetarian and for 396 students who said they were not vegetarian. Vegetarian 0.4 0.3 0.2 0.1 - 0.0 (a) What are the observational units? What are the variables, and what type of variable are they 140 150 160 170 180 190 200 Height (cm) (b) Write a few sentences comparing the distributions of height for the vegetarians and nonvegetarians. Not a Vegetarian 0.4 (c) Explain why it is better to use relative frequencies (proportions) rather than frequencies (counts) when comparing the vegetarians and nonvegetarians. 0.3 0.2 equency of Height (cm) Relative Frequency of Height (cm)

Glencoe Algebra 1, Student Edition, 9780079039897, 0079039898, 2018
18th Edition
ISBN:9780079039897
Author:Carter
Publisher:Carter
Chapter10: Statistics
Section10.3: Measures Of Spread
Problem 1GP

Related questions
Question
Transcribed Image Text:A random sample of 411 high school students
was selected in order to compare the heights, in
centimeters (cm), of vegetarians and
nonvegetarians. The relative-frequency
histograms below show the distributions of height
for the 15 students who said that they were
vegetarian and for 396 students who said they
were not vegetarian.
Vegetarian
0.4
0.3
0.2
0.1 -
0.0
(a) What are the observational units? What are
the variables, and what type of variable are they?
140
150
160
170
180
190
200
Height (cm)
(b) Write a few sentences comparing the
distributions of height for the vegetarians and
nonvegetarians.
Not a Vegetarian
0.4
(c) Explain why it is better to use relative
frequencies (proportions) rather than frequencies
(counts) when comparing the vegetarians and
nonvegetarians.
0.3
0.2
0.1 -
(d) Based on the design of this would it be
reasonable to conclude that being a vegetarian
causes students to be shorter, on average?
Explain.
0.0
140
150
160
170
180
190
200
Height (cm)
Relative Frequency of Height (cm)
Relative Frequency of Height (cm)
Expert Solution
This question has been solved!
Explore an expertly crafted, step-by-step solution for a thorough understanding of key concepts.

This is a popular solution!

Trending now
This is a popular solution!

Step by step
Solved in 2 steps

Recommended textbooks for you
Glencoe Algebra 1, Student Edition, 9780079039897…
Algebra
ISBN:
9780079039897
Author:
Carter
Publisher:
McGraw Hill
Glencoe Algebra 1, Student Edition, 9780079039897…
Algebra
ISBN:
9780079039897
Author:
Carter
Publisher:
McGraw Hill