A random sample of 748 voters in a large city were asked how they voted in the presidential election of 2012. Calculate chi square and the column percentages for each table below, and write a brief report describing the significance of the relationships as well as the patterns you observe.
A random sample of 748 voters in a large city were asked how they voted in the presidential election of 2012. Calculate chi square and the column percentages for each table below, and write a brief report describing the significance of the relationships as well as the patterns you observe.

Holt Mcdougal Larson Pre-algebra: Student Edition 2012
1st Edition
ISBN:9780547587776
Author:HOLT MCDOUGAL
Publisher:HOLT MCDOUGAL
Chapter11: Data Analysis And Probability
Section11.4: Collecting Data
Problem 6E

Related questions

Question
A random sample of 748 voters in a large city were asked how they voted in the presidential election of 2012. Calculate chi square and the column percentages for each table below, and write a brief report describing the significance of the relationships as well as the patterns you observe.
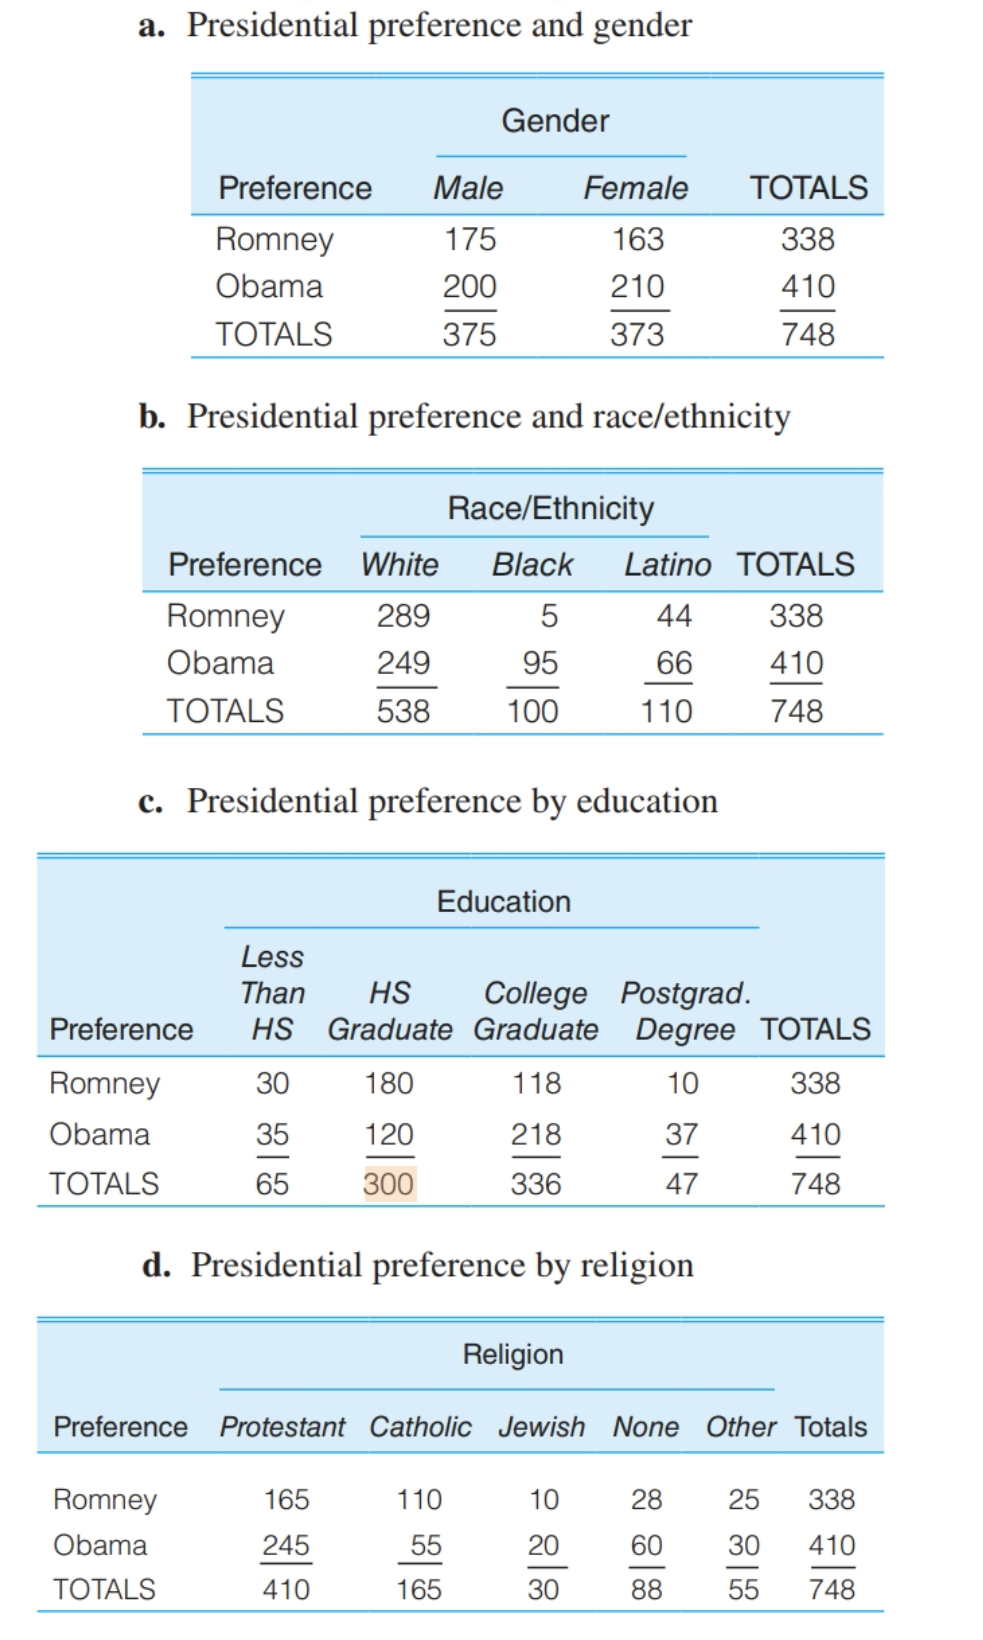
Transcribed Image Text:a. Presidential preference and gender
Gender
Preference
Male
Female
TOTALS
Romney
175
163
338
Obama
200
210
410
TOTALS
375
373
748
b. Presidential preference and race/ethnicity
Race/Ethnicity
Preference White
Black
Latino TOTALS
Romney
289
44
338
Obama
249
95
66
410
TOTALS
538
100
110
748
c. Presidential preference by education
Education
Less
Than
HS
College Postgrad.
HS Graduate Graduate Degree TOTALS
Preference
Romney
30
180
118
10
338
Obama
35
120
218
37
410
ТОTALS
65
300
336
47
748
d. Presidential preference by religion
Religion
Preference Protestant Catholic Jewish None Other Totals
Romney
165
110
10
28
25
338
Obama
245
55
20
60
30
410
TOTALS
410
165
30
88
55
748
Expert Solution
This question has been solved!
Explore an expertly crafted, step-by-step solution for a thorough understanding of key concepts.

This is a popular solution!

Trending now
This is a popular solution!

Step by step
Solved in 4 steps with 3 images

Knowledge Booster


Learn more about
Need a deep-dive on the concept behind this application? Look no further. Learn more about this topic, statistics and related others by exploring similar questions and additional content below.Recommended textbooks for you
Holt Mcdougal Larson Pre-algebra: Student Edition…
Algebra
ISBN:
9780547587776
Author:
HOLT MCDOUGAL
Publisher:
HOLT MCDOUGAL

Holt Mcdougal Larson Pre-algebra: Student Edition…
Algebra
ISBN:
9780547587776
Author:
HOLT MCDOUGAL
Publisher:
HOLT MCDOUGAL