A random sample of leading companies in South Korea gave the following percentage yields based on assets. 2.7 1.7 4,4 1.1 0.1 3.6 2.4 0.2 1.7 1.8 1.4 5.4 1.1 Use a calculator to verify that s = 2.449 for these South Korean companies. Another random sample of leading companies in Sweden gave the following percentage yields based on assets. 2.1 3.3 3.1 1.6 3.4 2.8 2.3 3.5 2.8 Use a calculator to verify that s? s 0.420 for these Swedish companies. Test the claim that the population variance of percentage yields on assets for South Korean companies is higher than that for companies in Sweden. Use a 5% level of significance. How could your test conclusion relate to an economist's question regarding volatility of corporate productivity of large companies in South Korea compared with those in Sweden? (a) What is the level of significance? State the null and alternate hypotheses. O H;: 0,? = 0,²; H;: 01 > 0, O H,: 0, > 0,²; H,: 0,2 = 0,2 O Ho: 0,? = 0,?; H;: 0,² > o,? O H,: 0,? = 0,²; H,: 0,? + 0,? (b) Find the value of the sample F statistic. (Use 2 decimal places.) What are the degrees of freedom? dfo What assumptions are you making about the original distribution? O The populations follow dependent normal distributions. We have random samples from each population. The populations follow independent chi-square distributions. We have random samples from each population. O The populations follow independent normal distributions. We have random samples from each population. The populations follow independent normal distributions. (c) Find or estimate the P-value of the sample test statistic.
A random sample of leading companies in South Korea gave the following percentage yields based on assets. 2.7 1.7 4,4 1.1 0.1 3.6 2.4 0.2 1.7 1.8 1.4 5.4 1.1 Use a calculator to verify that s = 2.449 for these South Korean companies. Another random sample of leading companies in Sweden gave the following percentage yields based on assets. 2.1 3.3 3.1 1.6 3.4 2.8 2.3 3.5 2.8 Use a calculator to verify that s? s 0.420 for these Swedish companies. Test the claim that the population variance of percentage yields on assets for South Korean companies is higher than that for companies in Sweden. Use a 5% level of significance. How could your test conclusion relate to an economist's question regarding volatility of corporate productivity of large companies in South Korea compared with those in Sweden? (a) What is the level of significance? State the null and alternate hypotheses. O H;: 0,? = 0,²; H;: 01 > 0, O H,: 0, > 0,²; H,: 0,2 = 0,2 O Ho: 0,? = 0,?; H;: 0,² > o,? O H,: 0,? = 0,²; H,: 0,? + 0,? (b) Find the value of the sample F statistic. (Use 2 decimal places.) What are the degrees of freedom? dfo What assumptions are you making about the original distribution? O The populations follow dependent normal distributions. We have random samples from each population. The populations follow independent chi-square distributions. We have random samples from each population. O The populations follow independent normal distributions. We have random samples from each population. The populations follow independent normal distributions. (c) Find or estimate the P-value of the sample test statistic.

Functions and Change: A Modeling Approach to College Algebra (MindTap Course List)
6th Edition
ISBN:9781337111348
Author:Bruce Crauder, Benny Evans, Alan Noell
Publisher:Bruce Crauder, Benny Evans, Alan Noell
Chapter4: Exponential Functions
Section4.4: Modeling Nearly Exponential Data
Problem 3E: Special Rounding Instructions For this exercise set, round all regression parameters to three...

Related questions

Topic Video
Question
Transcribed Image Text:W Math 2250 Unit 4 Post Test Re X
b Statistics Question | bartleby
->
A webassign.net/web/Student/Assignment-Responses/last?dep=24515412
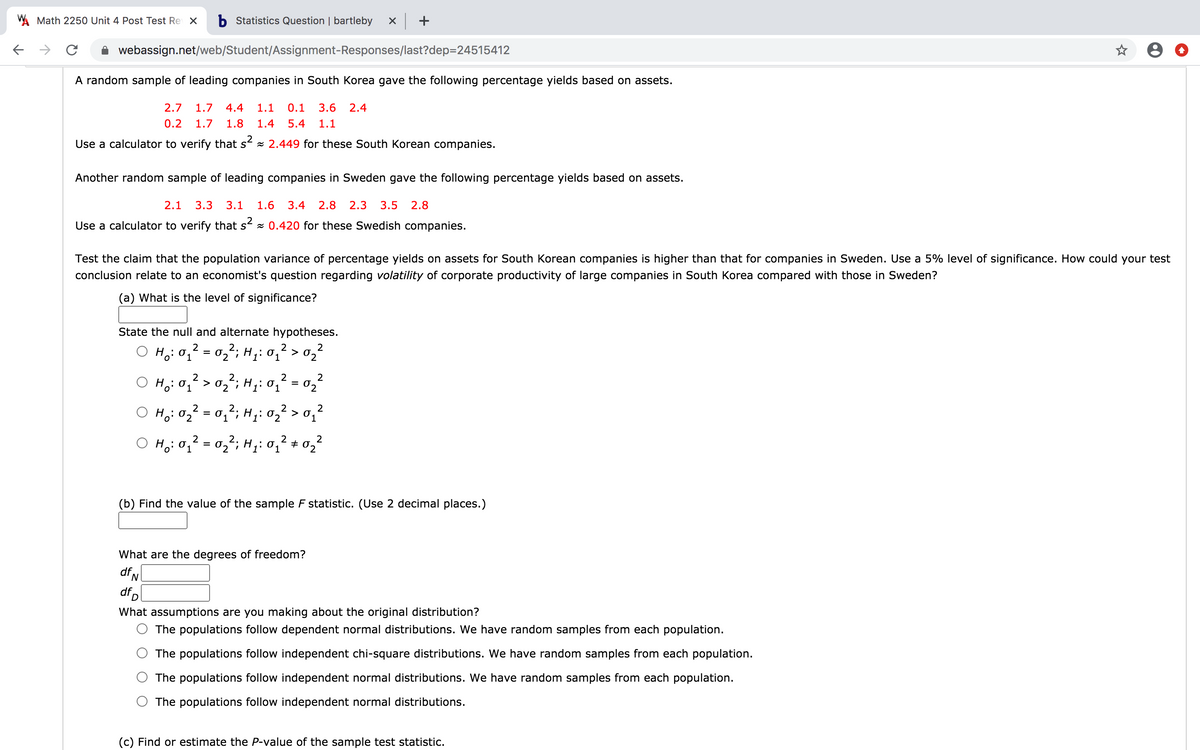
A random sample of leading companies in South Korea gave the following percentage yields based on assets.
2.7
1.7
4.4
1.1
0.1
3.6
2.4
0.2
1.7
1.8
1.4
5.4
1.1
Use a calculator to verify that s x 2.449 for these South Korean companies.
Another random sample of leading companies in Sweden gave the following percentage yields based on assets.
2.1
3.3
3.1
1.6
3.4
2.8
2.3
3.5
2.8
Use a calculator to verify that s x 0.420 for these Swedish companies.
Test the claim that the population variance of percentage yields on assets for South Korean companies is higher than that for companies in Sweden. Use a 5% level of significance. How could your test
conclusion relate to an economist's question regarding volatility of corporate productivity of large companies in South Korea compared with those in Sweden?
(a) What is the level of significance?
State the null and alternate hypotheses.
2
2.
Ho: 0, = 0,; H1: 01 > 0,²
2
2.
Ho: 01 > 02"; H;: 01
2
02
O Ho:02² = 0,²; H;: 02² > o,'
%3D
2
1
2.
H: 0, = 02; H;: 0, + 02
(b) Find the value of the sample F statistic. (Use 2 decimal places.)
What are the degrees of freedom?
dfN
dfp
What assumptions are you making about the original distribution?
The populations follow dependent normal distributions. We have random samples from each population.
The populations follow independent chi-square distributions. We have random samples from each population.
The populations follow independent normal distributions. We have random samples from each population.
The populations follow independent normal distributions.
(c) Find or estimate the P-value of the sample test statistic.
Transcribed Image Text:W Math 2250 Unit 4 Post Test Re X
b Statistics Question | bartleby
->
webassign.net/web/Student/Assignment-Responses/last?dep=24515412
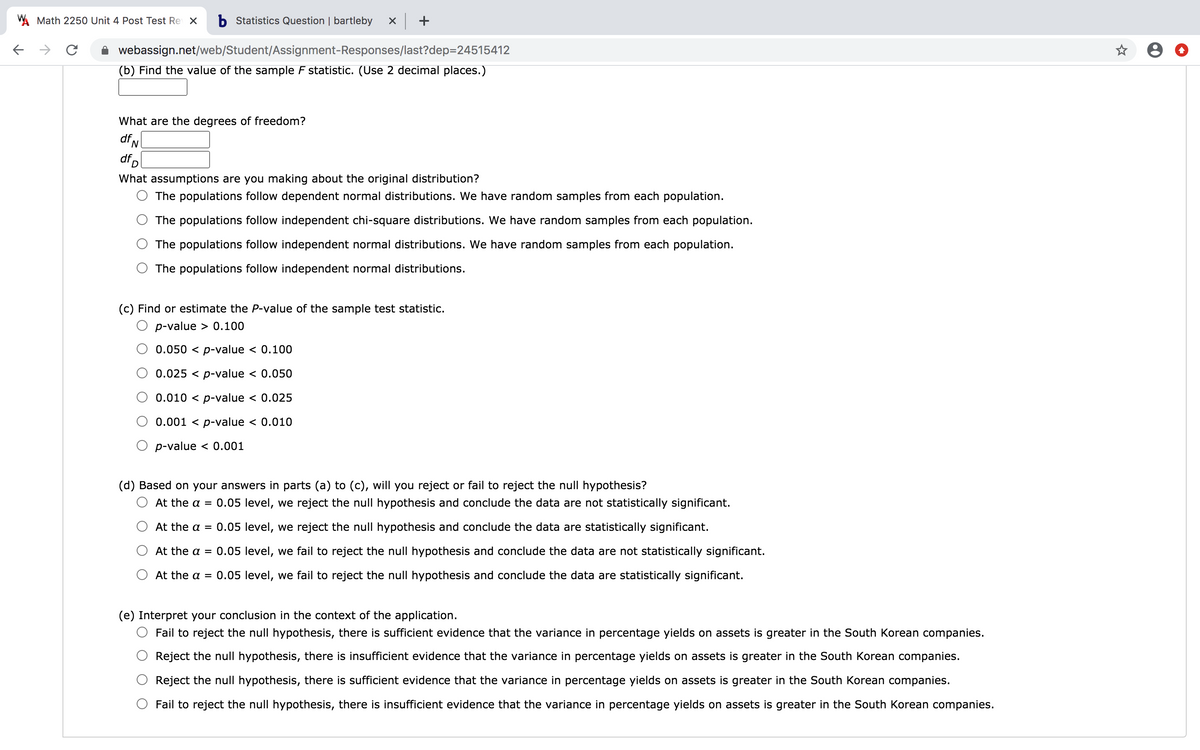
(b) Find the value of the sample F statistic. (Use 2 decimal places.)
What are the degrees of freedom?
df,
dfp
What assumptions are you making about the original distribution?
The populations follow dependent normal distributions. We have random samples from each population.
The populations follow independent chi-square distributions. We have random samples from each population.
The populations follow independent normal distributions. We have random samples from each population.
The populations follow independent normal distributions.
(c) Find or estimate the P-value of the sample test statistic.
p-value > 0.100
0.050 < p-value < 0.100
0.025 < p-value < 0.050
0.010 < p-value < 0.025
0.001 < p-value < 0.010
p-value < 0.001
(d) Based on your answers in parts (a) to (c), will you reject or fail to reject the null hypothesis?
At the a = 0.05 level, we reject the null hypothesis and conclude the data are not statistically significant.
At the a = 0.05 level, we reject the null hypothesis and conclude the data are statistically significant.
At the a = 0.05 level, we fail to reject the null hypothesis and conclude the data are not statistically significant.
At the a = 0.05 level, we fail to reject the null hypothesis and conclude the data are statistically significant.
(e) Interpret your conclusion in the context of the application.
Fail to reject the null hypothesis, there is sufficient evidence that the variance in percentage yields on assets is greater in the South Korean companies.
Reject the null hypothesis, there is insufficient evidence that the variance in percentage yields on assets is greater in the South Korean companies.
Reject the null hypothesis, there is sufficient evidence that the variance in percentage yields on assets is greater in the South Korean companies.
Fail to reject the null hypothesis, there is insufficient evidence that the variance in percentage yields on assets is greater in the South Korean companies.
Expert Solution
This question has been solved!
Explore an expertly crafted, step-by-step solution for a thorough understanding of key concepts.

Step by step
Solved in 3 steps with 1 images

Knowledge Booster


Learn more about
Need a deep-dive on the concept behind this application? Look no further. Learn more about this topic, statistics and related others by exploring similar questions and additional content below.Recommended textbooks for you
Functions and Change: A Modeling Approach to Coll…
Algebra
ISBN:
9781337111348
Author:
Bruce Crauder, Benny Evans, Alan Noell
Publisher:
Cengage Learning

Glencoe Algebra 1, Student Edition, 9780079039897…
Algebra
ISBN:
9780079039897
Author:
Carter
Publisher:
McGraw Hill
Functions and Change: A Modeling Approach to Coll…
Algebra
ISBN:
9781337111348
Author:
Bruce Crauder, Benny Evans, Alan Noell
Publisher:
Cengage Learning
Glencoe Algebra 1, Student Edition, 9780079039897…
Algebra
ISBN:
9780079039897
Author:
Carter
Publisher:
McGraw Hill