A random sample of non-industrialized countries was selected, and the life expectancy in years is listed for both men and women. Given that the correlation coefficient is significant, find the equation of the regression line. Men, x 59.7 72.9 41.9 46.2 50.3 43.2 Women, y 63.8 77.8 44.5 48.3 54.0 43.5
A random sample of non-industrialized countries was selected, and the life expectancy in years is listed for both men and women. Given that the correlation coefficient is significant, find the equation of the regression line. Men, x 59.7 72.9 41.9 46.2 50.3 43.2 Women, y 63.8 77.8 44.5 48.3 54.0 43.5

College Algebra
7th Edition
ISBN:9781305115545
Author:James Stewart, Lothar Redlin, Saleem Watson
Publisher:James Stewart, Lothar Redlin, Saleem Watson
Chapter1: Equations And Graphs
Section: Chapter Questions
Problem 10T: Olympic Pole Vault The graph in Figure 7 indicates that in recent years the winning Olympic men’s...

Related questions

Concept explainers
Equations and Inequations
Equations and inequalities describe the relationship between two mathematical expressions.
Linear Functions
A linear function can just be a constant, or it can be the constant multiplied with the variable like x or y. If the variables are of the form, x2, x1/2 or y2 it is not linear. The exponent over the variables should always be 1.
Question
18.
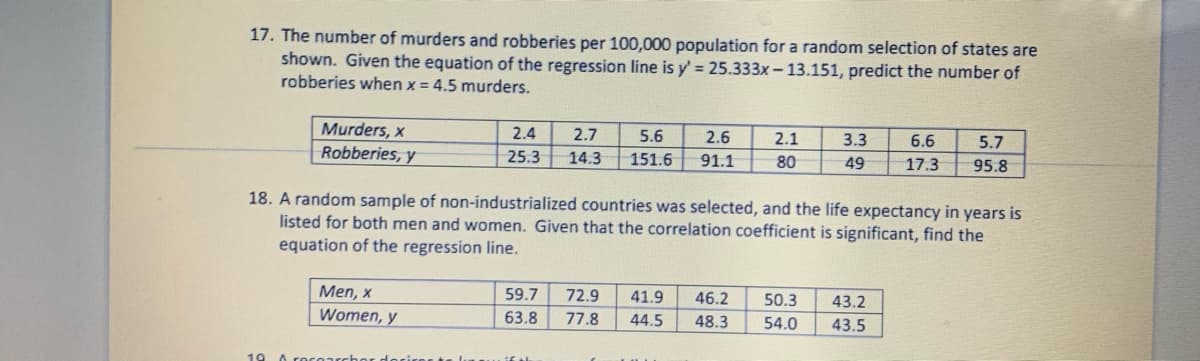
Transcribed Image Text:17. The number of murders and robberies per 100,000 population for a random selection of states are
shown. Given the equation of the regression line is y' = 25.333x- 13.151, predict the number of
robberies when x = 4.5 murders.
Murders, x
Robberies, y
2.4
2.7
5.6
2.6
2.1
3.3
6.6
5.7
25.3
14.3
151.6
91.1
80
49
17.3
95.8
18. A random sample of non-industrialized countries was selected, and the life expectancy in years is
listed for both men and women. Given that the correlation coefficient is significant, find the
equation of the regression line.
Men, x
59.7
72.9
41.9
46.2
50.3
43.2
Women, y
63.8
77.8
44.5
48.3
54.0
43.5
19
Expert Solution
This question has been solved!
Explore an expertly crafted, step-by-step solution for a thorough understanding of key concepts.

This is a popular solution!

Trending now
This is a popular solution!

Step by step
Solved in 3 steps with 1 images

Knowledge Booster


Learn more about
Need a deep-dive on the concept behind this application? Look no further. Learn more about this topic, statistics and related others by exploring similar questions and additional content below.Recommended textbooks for you
College Algebra
Algebra
ISBN:
9781305115545
Author:
James Stewart, Lothar Redlin, Saleem Watson
Publisher:
Cengage Learning
College Algebra
Algebra
ISBN:
9781305115545
Author:
James Stewart, Lothar Redlin, Saleem Watson
Publisher:
Cengage Learning