A real estate agent Jennifer Nguyen was asked to analyze the one-bedroom condo prices in the GTA. She took a random sample of 9 condos in Downtown Toronto and another random sample of 6 condos in Yorkville. The sample means (in $ thousands) are 1 = 739 for Downtown Toronto and ₂ 668 for Yorkville. Historically the population standard deviations (in $ thousands) are σ1 99 for Downtown Toronto and 02 62 for Yorkville. Could Jennifer Nguyen claim at a 1% level of significance that the average price in Downtown Toronto is higher than the average price in Yorkville? Use the z-test for independent samples and the formula, 2 st = - (₁₂) — (μ₁ − μ₂) - - - 01 n1 Ho: Select an answer ✓ + O H₁ O Ho ?v H1: Select an answer ?v Note: The nature of the distributions and availability of ₁ and 2 allow us to use z- approach, though both samples are comparatively small. (a) State the null and alternative hypotheses, and identify which one is the claim. Which one is the claim? σ n₂ - ANNE
A real estate agent Jennifer Nguyen was asked to analyze the one-bedroom condo prices in the GTA. She took a random sample of 9 condos in Downtown Toronto and another random sample of 6 condos in Yorkville. The sample means (in $ thousands) are 1 = 739 for Downtown Toronto and ₂ 668 for Yorkville. Historically the population standard deviations (in $ thousands) are σ1 99 for Downtown Toronto and 02 62 for Yorkville. Could Jennifer Nguyen claim at a 1% level of significance that the average price in Downtown Toronto is higher than the average price in Yorkville? Use the z-test for independent samples and the formula, 2 st = - (₁₂) — (μ₁ − μ₂) - - - 01 n1 Ho: Select an answer ✓ + O H₁ O Ho ?v H1: Select an answer ?v Note: The nature of the distributions and availability of ₁ and 2 allow us to use z- approach, though both samples are comparatively small. (a) State the null and alternative hypotheses, and identify which one is the claim. Which one is the claim? σ n₂ - ANNE

Glencoe Algebra 1, Student Edition, 9780079039897, 0079039898, 2018
18th Edition
ISBN:9780079039897
Author:Carter
Publisher:Carter
Chapter10: Statistics
Section10.5: Comparing Sets Of Data
Problem 14PPS

Related questions
Question
The question is complete, find part a-e on the images and part f on text below
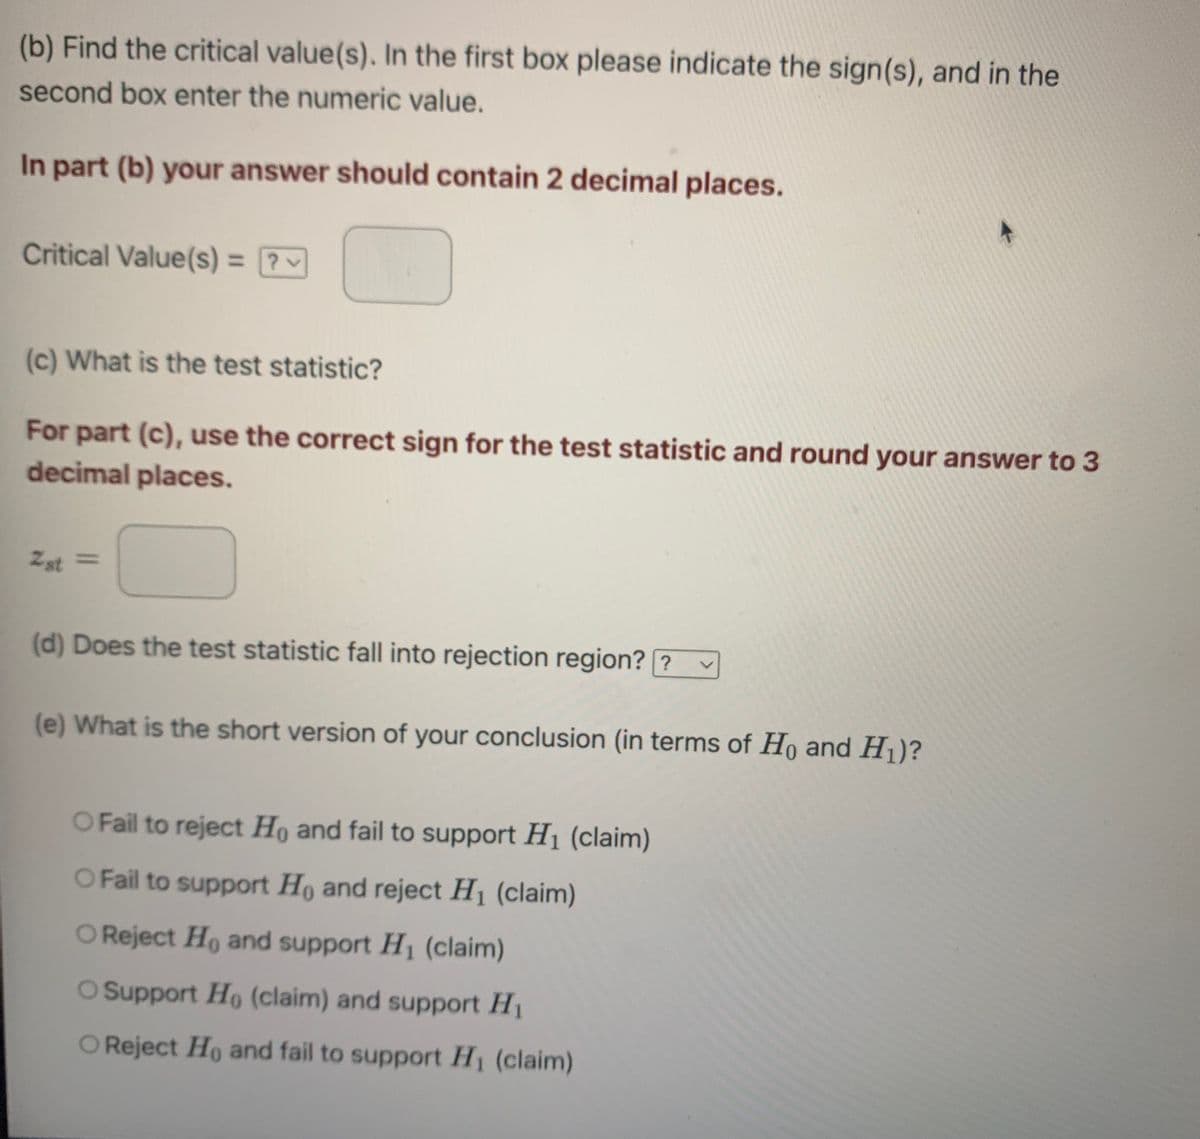
Transcribed Image Text:(b) Find the critical value(s). In the first box please indicate the sign(s), and in the
second box enter the numeric value.
In part (b) your answer should contain 2 decimal places.
Critical Value(s) = ?
v
(c) What is the test statistic?
For part (c), use the correct sign for the test statistic and round your answer to 3
decimal places.
2st =
(d) Does the test statistic fall into rejection region? ?
(e) What is the short version of your conclusion (in terms of Ho and H₁)?
O Fail to reject Ho and fail to support H₁ (claim)
O Fail to support Ho and reject H₁ (claim)
O Reject Ho and support H₁ (claim)
O Support Ho (claim) and support H₁
O Reject Ho and fail to support H₁ (claim)
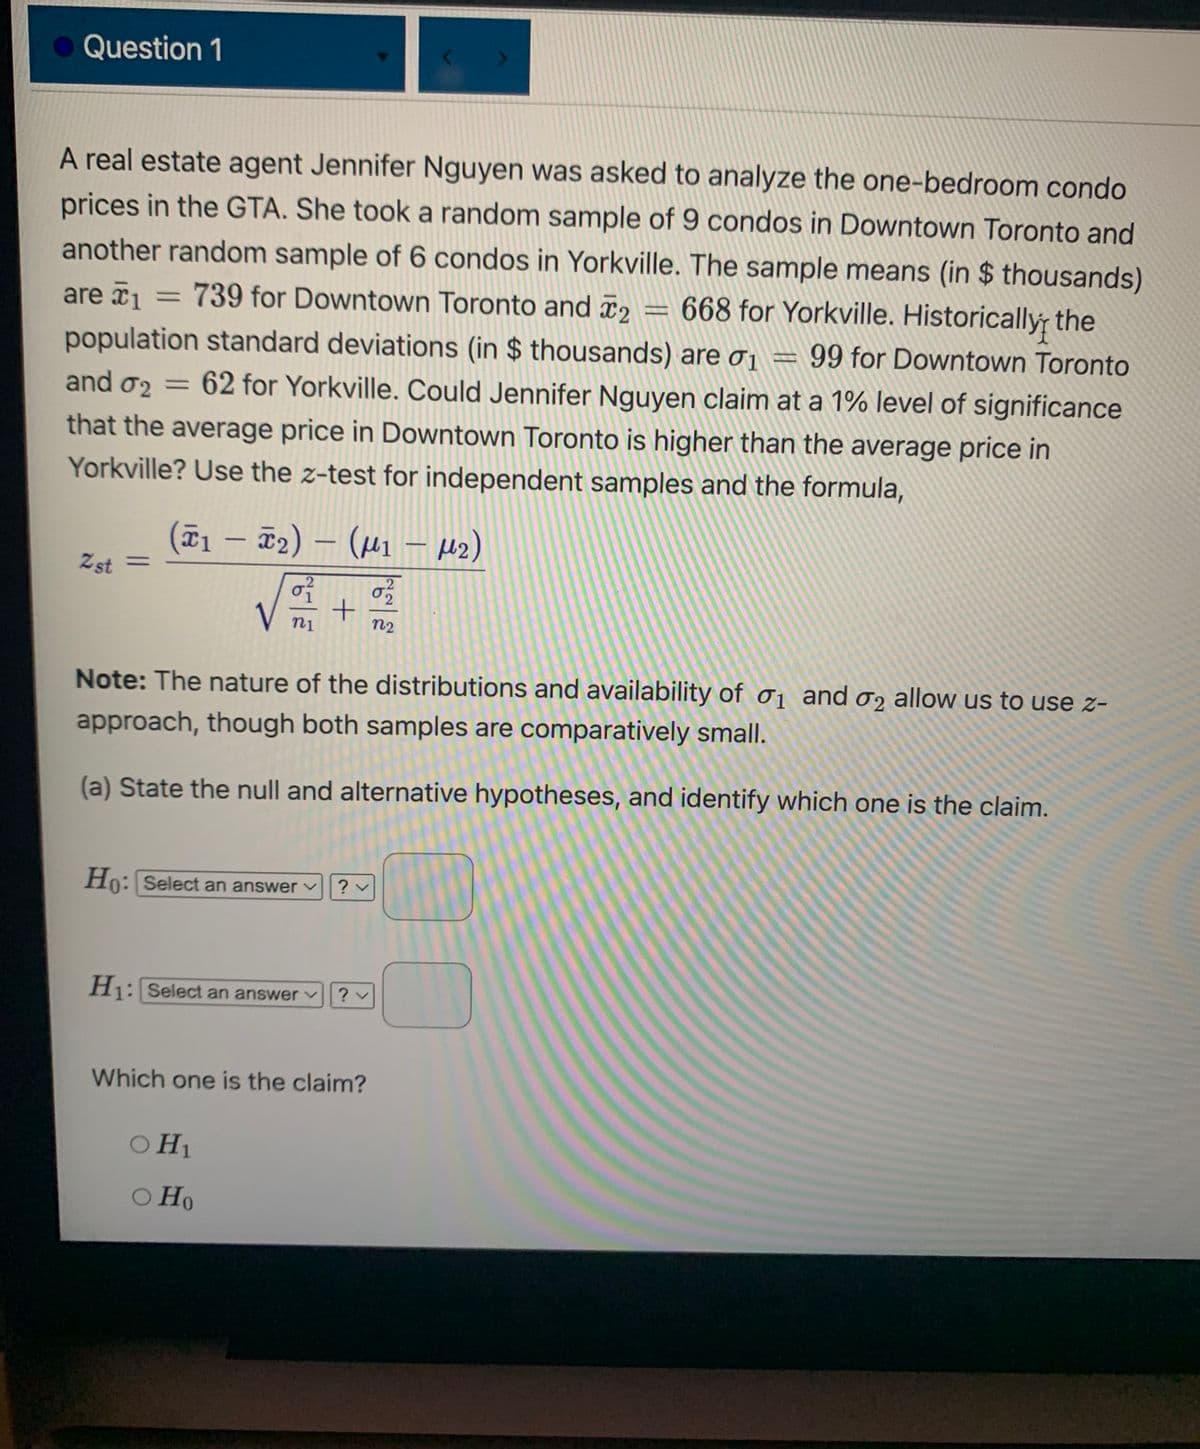
Transcribed Image Text:Question 1
A real estate agent Jennifer Nguyen was asked to analyze the one-bedroom condo
prices in the GTA. She took a random sample of 9 condos in Downtown Toronto and
another random sample of 6 condos in Yorkville. The sample means (in $thousands)
are ₁ = 739 for Downtown Toronto and 2 = 668 for Yorkville. Historically the
1
population standard deviations (in $ thousands) are σ₁ = 99 for Downtown Toronto
and 02 = 62 for Yorkville. Could Jennifer Nguyen claim at a 1% level of significance
that the average price in Downtown Toronto is higher than the average price in
Yorkville? Use the z-test for independent samples and the formula,
M₂)
2st =
(Ã1 — Ñ₂) — (µ₁
-
-
0² 0²/22
+ N22
V n₁
Note: The nature of the distributions and availability of 1 and 2 allow us to use z-
approach, though both samples are comparatively small.
(a) State the null and alternative hypotheses, and identify which one is the claim.
Ho: Select an answer
H₁: Select an answer ✓
O H₁
O Ho
? v
?v
Which one is the claim?
0
Expert Solution
This question has been solved!
Explore an expertly crafted, step-by-step solution for a thorough understanding of key concepts.

Step by step
Solved in 2 steps with 2 images

Recommended textbooks for you
Glencoe Algebra 1, Student Edition, 9780079039897…
Algebra
ISBN:
9780079039897
Author:
Carter
Publisher:
McGraw Hill
Glencoe Algebra 1, Student Edition, 9780079039897…
Algebra
ISBN:
9780079039897
Author:
Carter
Publisher:
McGraw Hill