A report just came out that stated that 23.8% of all Americans say that vanilla is their favorite ice cream, 20.9% say that chocolate is their favorite, 9.1% favor butter pecan, 8.2% favor strawberry, and the rest have other favorites. An ice cream shop owner thinks that her customers are not like the rest of America. The table below shows the results of 555 of her patrons' ice cream selections. What can be concluded at the a = 0.05 significance level? a. Complete the table by filling in the expected frequencies. Round your answers to the nearest whole number. Frequencies of Favorite Ice Cream Outcome Frequency Expected Frequency vanilla 216 Chocolate 195 Butter Pecan 91 Strawberry 52 Other 361 b. What is the correct statistical test to use? Select an answer V c. What are the null and alternative hypotheses? Họ: O The distribution of favorite ice cream for customers at her shop is the same as it is for Americans in neneral
A report just came out that stated that 23.8% of all Americans say that vanilla is their favorite ice cream, 20.9% say that chocolate is their favorite, 9.1% favor butter pecan, 8.2% favor strawberry, and the rest have other favorites. An ice cream shop owner thinks that her customers are not like the rest of America. The table below shows the results of 555 of her patrons' ice cream selections. What can be concluded at the a = 0.05 significance level? a. Complete the table by filling in the expected frequencies. Round your answers to the nearest whole number. Frequencies of Favorite Ice Cream Outcome Frequency Expected Frequency vanilla 216 Chocolate 195 Butter Pecan 91 Strawberry 52 Other 361 b. What is the correct statistical test to use? Select an answer V c. What are the null and alternative hypotheses? Họ: O The distribution of favorite ice cream for customers at her shop is the same as it is for Americans in neneral

Glencoe Algebra 1, Student Edition, 9780079039897, 0079039898, 2018
18th Edition
ISBN:9780079039897
Author:Carter
Publisher:Carter
Chapter10: Statistics
Section10.6: Summarizing Categorical Data
Problem 11CYU

Related questions
Question
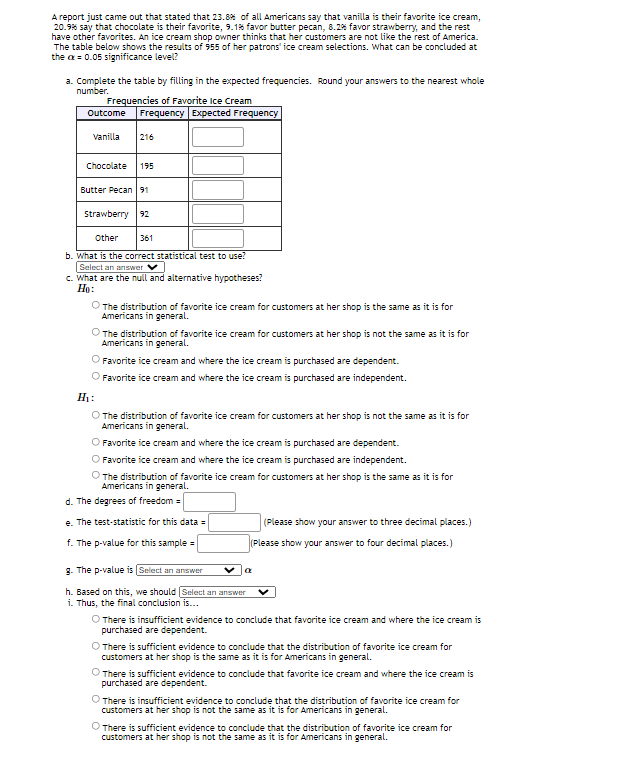
Transcribed Image Text:A report just came out that stated that 23.8% of all Americans say that vanilla is their favorite ice cream,
20.9% say that chocolate is their favorite, 9.1% favor butter pecan, 8.2% favor strawberry, and the rest
have other favorites. An ice cream shop owner thinks that her customers are not like the rest of America.
The table below shows the results of $55 of her patrons' ice cream selections. What can be concluded at
the a = 0.05 significance level?
a. Complete the table by filling in the expected frequencies. Round your answers to the nearest whole
number.
Frequencies of Favorite Ice Cream
Outcome
Frequency Expected Frequency
vanilla
216
Chocolate
195
Butter Pecan91
Strawberry 92
Other
361
b. What is the correct statistical test to use?
Select an answer V
c. What are the null and alternative hypotheses?
Но:
O The distribution of favorite ice cream for customers at her shop is the same as it is for
Americans in general.
O The distribution of favorite ice cream for customers at her shop is not the same as it is for
Americans in general.
O Favorite ice cream and where the ice cream is purchased are dependent.
O Favorite ice cream and where the ice cream is purchased are independent.
H1:
O The distribution of favorite ice cream for customers at her shop is not the same as it is for
Americans in general.
O Favorite ice cream and where the ice cream is purchased are dependent.
O Favorite ice cream and where the ice cream is purchased are independent.
O The distribution of favorite ice cream for customers at her shop is the same as it is for
Americans in general.
d. The degrees of freedom =
e. The test-statistic for this data =
(Please show your answer to three decimal places.)
f. The p-value for this sample
(Please show your answer to four decimal places.)
3. The p-value is Select an answer
h. Based on this, we should Select an answer
i. Thus, the final conclusion is...
O There is insufficient evidence to conclude that favorite ice cream and where the ice cream is
purchased are dependent.
O There is sufficient evidence to conclude that the distribution of favorite ice cream for
customers at her shop is the same as it is for Americans in general.
O There is sufficient evidence to conclude that favorite ice cream and where the ice cream is
purchased are dependent.
O There is insufficient evidence to conclude that the distribution of favorite ice cream for
customers at her shop is not the same as it is for Americans in general.
O There is sufficient evidence to conclude that the distribution of favorite ice cream for
customers at her shop is not the same as it is for Americans in general.
Expert Solution
This question has been solved!
Explore an expertly crafted, step-by-step solution for a thorough understanding of key concepts.

This is a popular solution!

Trending now
This is a popular solution!

Step by step
Solved in 3 steps with 2 images

Recommended textbooks for you
Glencoe Algebra 1, Student Edition, 9780079039897…
Algebra
ISBN:
9780079039897
Author:
Carter
Publisher:
McGraw Hill


Big Ideas Math A Bridge To Success Algebra 1: Stu…
Algebra
ISBN:
9781680331141
Author:
HOUGHTON MIFFLIN HARCOURT
Publisher:
Houghton Mifflin Harcourt
Glencoe Algebra 1, Student Edition, 9780079039897…
Algebra
ISBN:
9780079039897
Author:
Carter
Publisher:
McGraw Hill
Big Ideas Math A Bridge To Success Algebra 1: Stu…
Algebra
ISBN:
9781680331141
Author:
HOUGHTON MIFFLIN HARCOURT
Publisher:
Houghton Mifflin Harcourt

Holt Mcdougal Larson Pre-algebra: Student Edition…
Algebra
ISBN:
9780547587776
Author:
HOLT MCDOUGAL
Publisher:
HOLT MCDOUGAL