am anagement Management s al First Year Second Year Third Year Population % Population % Population % Population 100 200 150 90 70 250 760 = 31.7 32.6 31.0 35.0 29.1 180 130 80 50 230 670 28.6 28.3 27.6 25.0 26.7 150 100 70 40 200 560 23.8 21.7 24.1 20.0 23.3 above are with respect to the student population in each Program per Year Level. Fourth Year 586888 15.9 80 17.4 17.2 20.0 20.9 50 40 180 450 Total 630 460 290 200 860 2,440 ollowing: he total population of 2,440 students, what is the required sample size, n? Use a tolerable error a reliability of 95%, and a standard deviation of 10. computation here College Program BS Business Management BS Hospitality Management BS Psychology BS Mathematics BS Education Total Sample Size (n) First Year per Program per Year Level Third Year Second Year Provide a sample computation here using Business Management data
am anagement Management s al First Year Second Year Third Year Population % Population % Population % Population 100 200 150 90 70 250 760 = 31.7 32.6 31.0 35.0 29.1 180 130 80 50 230 670 28.6 28.3 27.6 25.0 26.7 150 100 70 40 200 560 23.8 21.7 24.1 20.0 23.3 above are with respect to the student population in each Program per Year Level. Fourth Year 586888 15.9 80 17.4 17.2 20.0 20.9 50 40 180 450 Total 630 460 290 200 860 2,440 ollowing: he total population of 2,440 students, what is the required sample size, n? Use a tolerable error a reliability of 95%, and a standard deviation of 10. computation here College Program BS Business Management BS Hospitality Management BS Psychology BS Mathematics BS Education Total Sample Size (n) First Year per Program per Year Level Third Year Second Year Provide a sample computation here using Business Management data

Holt Mcdougal Larson Pre-algebra: Student Edition 2012
1st Edition
ISBN:9780547587776
Author:HOLT MCDOUGAL
Publisher:HOLT MCDOUGAL
Chapter11: Data Analysis And Probability
Section11.5: Interpreting Data
Problem 1C

Related questions
Question
100%
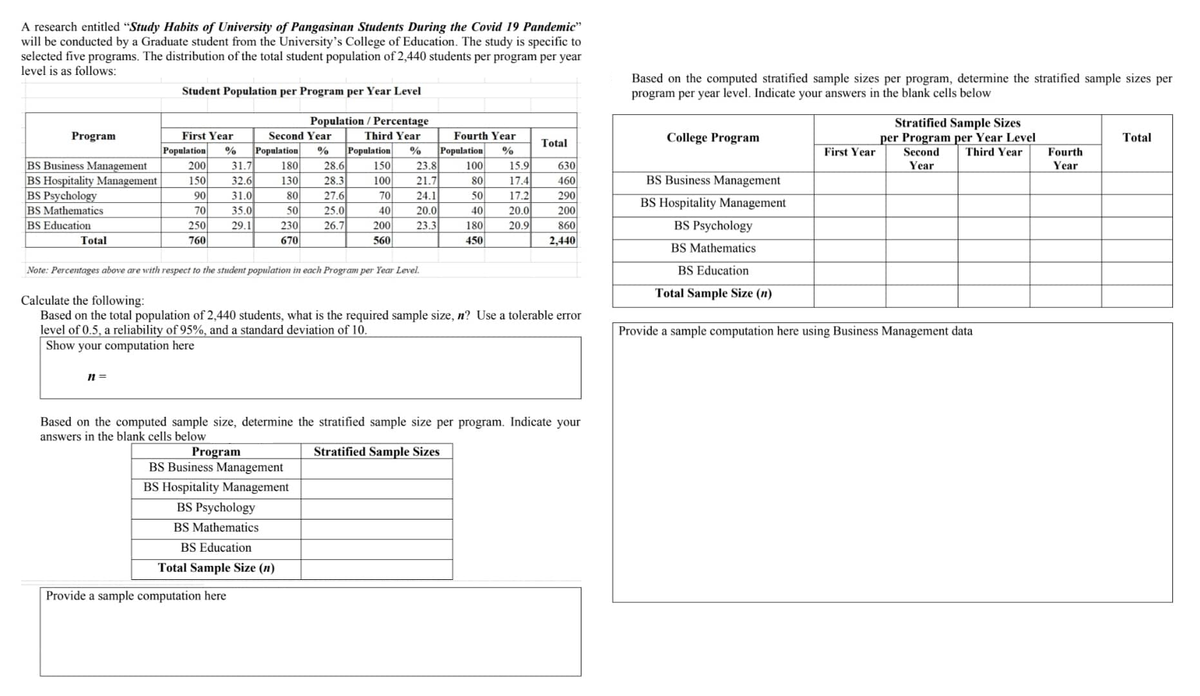
Transcribed Image Text:A research entitled "Study Habits of University of Pangasinan Students During the Covid 19 Pandemic"
will be conducted by a Graduate student from the University's College of Education. The study is specific to
selected five programs. The distribution of the total student population of 2,440 students per program per year
level is as follows:
Program
BS Business Management
BS Hospitality Management
BS Psychology
BS Mathematics
BS Education
Total
Student Population per Program per Year Level
Population / Percentage
First Year
Second Year
Third Year
Population % Population % Population %
200 31.7 180 28.6 150 23.8
32.6
100
70
40
150
130
28.3
21.7
24.1
90
31.0
80
27.6
70
35.0
50
25.0
20.0
250
29.1
230
26.7
200
23.3
760
670
560
Note: Percentages above are with respect to the student population each Program per Year Level.
n =
Fourth Year
Population %
100
80
50
40
180
450
15.9
17.4
17.2
20.0
20.9
Provide a sample computation here
Total
630
460
290
Calculate the following:
Based on the total population of 2,440 students, what is the required sample size, n? Use a tolerable error
level of 0.5, a reliability of 95%, and a standard deviation of 10.
Show your computation here
200
860
2,440
Based on the computed sample size, determine the stratified sample size per program. Indicate your
answers in the blank cells below
Program
Stratified Sample Sizes
BS Business Management
BS Hospitality Management
BS Psychology
BS Mathematics
BS Education
Total Sample Size (n)
Based on the computed stratified sample sizes per program, determine the stratified sample sizes per
program per year level. Indicate your answers in the blank cells below:
College Program
BS Business Management
BS Hospitality Management
BS Psychology
BS Mathematics
BS Education
Total Sample Size (n)
First Year
Stratified Sample Sizes
per Program per Year Level
Second
Year
Third Year
Provide a sample computation here using Business Management data
Fourth
Year
Total
Expert Solution
This question has been solved!
Explore an expertly crafted, step-by-step solution for a thorough understanding of key concepts.

Step by step
Solved in 3 steps

Recommended textbooks for you
Holt Mcdougal Larson Pre-algebra: Student Edition…
Algebra
ISBN:
9780547587776
Author:
HOLT MCDOUGAL
Publisher:
HOLT MCDOUGAL
Holt Mcdougal Larson Pre-algebra: Student Edition…
Algebra
ISBN:
9780547587776
Author:
HOLT MCDOUGAL
Publisher:
HOLT MCDOUGAL