A researcher calculated the Pearson correlation on the following data and found it to be r = -1. What is the missing value? Y 12 ? 12 3 а. 6 O b. 7 с. 8 O d. 9 O O O LO
A researcher calculated the Pearson correlation on the following data and found it to be r = -1. What is the missing value? Y 12 ? 12 3 а. 6 O b. 7 с. 8 O d. 9 O O O LO

Glencoe Algebra 1, Student Edition, 9780079039897, 0079039898, 2018
18th Edition
ISBN:9780079039897
Author:Carter
Publisher:Carter
Chapter4: Equations Of Linear Functions
Section4.5: Correlation And Causation
Problem 23PFA

Related questions
Question
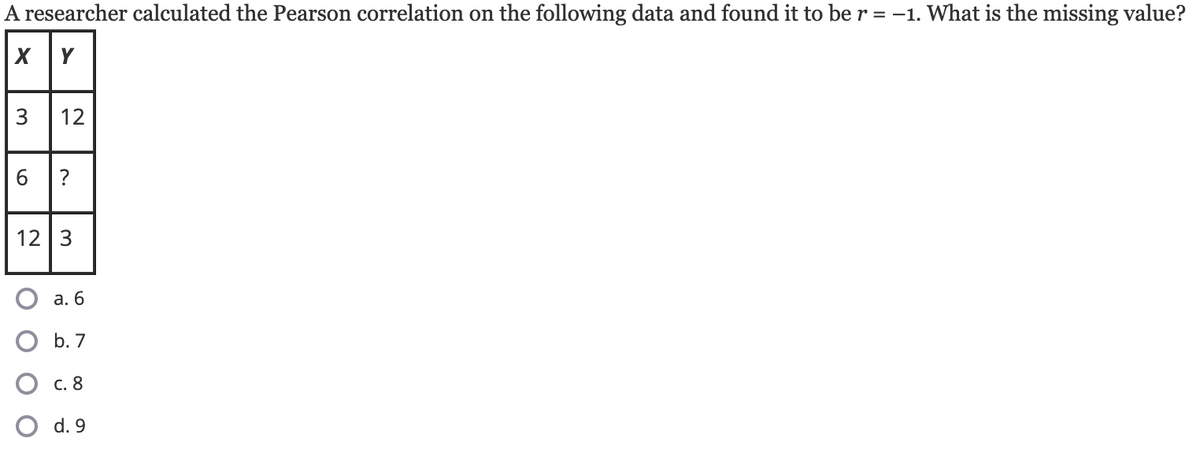
Transcribed Image Text:A researcher calculated the Pearson correlation on the following data and found it to be r = -1. What is the missing value?
12
6 |?
12 3
а. 6
b. 7
с. 8
d. 9
O O
Expert Solution
This question has been solved!
Explore an expertly crafted, step-by-step solution for a thorough understanding of key concepts.

This is a popular solution!

Trending now
This is a popular solution!

Step by step
Solved in 3 steps with 2 images

Recommended textbooks for you
Glencoe Algebra 1, Student Edition, 9780079039897…
Algebra
ISBN:
9780079039897
Author:
Carter
Publisher:
McGraw Hill
Glencoe Algebra 1, Student Edition, 9780079039897…
Algebra
ISBN:
9780079039897
Author:
Carter
Publisher:
McGraw Hill