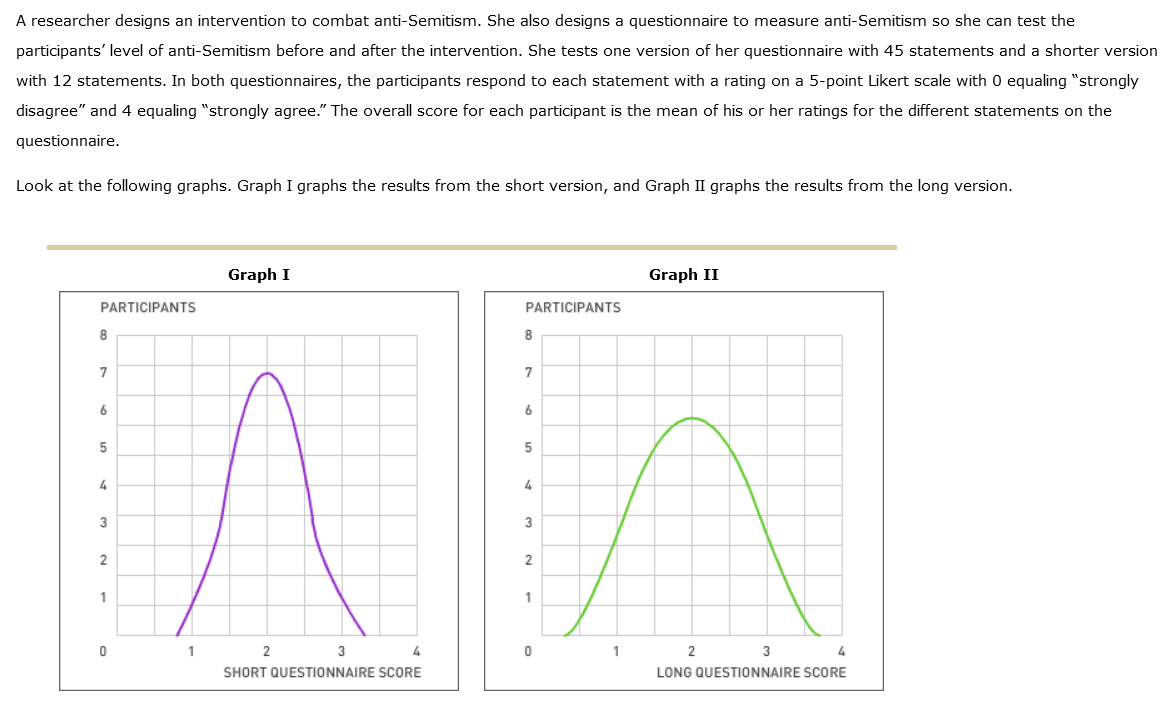
A researcher designs an intervention to combat anti-Semitism. She also designs a questionnaire to measure anti-Semitism so she can test the participants' level of anti-Semitism before and after the intervention. She tests one version of her questionnaire with 45 statements and a shorter version with 12 statements. In both questionnaires, the participants respond to each statement with a rating on a 5-point Likert scale with O equaling "strongly disagree" and 4 equaling "strongly agree." The overall score for each participant is the mean of his or her ratings for the different statements on the questionnaire. Look at the following graphs. Graph I graphs the results from the short version, and Graph II graphs the results from the long version. PARTICIPANTS 8 7 6 5 4 3 2 1 0 1 Graph I 2 3 4 SHORT QUESTIONNAIRE SCORE PARTICIPANTS 8 7 6 5 4 3 2 1 0 1 Graph II 2 3 4 LONG QUESTIONNAIRE SCORE
A researcher designs an intervention to combat anti-Semitism. She also designs a questionnaire to measure anti-Semitism so she can test the participants' level of anti-Semitism before and after the intervention. She tests one version of her questionnaire with 45 statements and a shorter version with 12 statements. In both questionnaires, the participants respond to each statement with a rating on a 5-point Likert scale with O equaling "strongly disagree" and 4 equaling "strongly agree." The overall score for each participant is the mean of his or her ratings for the different statements on the questionnaire. Look at the following graphs. Graph I graphs the results from the short version, and Graph II graphs the results from the long version. PARTICIPANTS 8 7 6 5 4 3 2 1 0 1 Graph I 2 3 4 SHORT QUESTIONNAIRE SCORE PARTICIPANTS 8 7 6 5 4 3 2 1 0 1 Graph II 2 3 4 LONG QUESTIONNAIRE SCORE

Holt Mcdougal Larson Pre-algebra: Student Edition 2012
1st Edition
ISBN:9780547587776
Author:HOLT MCDOUGAL
Publisher:HOLT MCDOUGAL
Chapter11: Data Analysis And Probability
Section: Chapter Questions
Problem 8CR

Related questions
Question
Please answer the questions correlty and please answer all the questions with what it regards in saying exactly, please and thank you take your time. Ive read the guide lines and honor code that i can have up to Submit only one question at a time under the appropriate subject. A question can have up to 3 subparts (i.e. part a, b, and c). If you dont belive me here is the link of barthleby saying exactly that thanks: https://bartleby.zendesk.com/hc/en-us/articles/360017462394-How-can-I-ensure-my-questions-get-answered-as-quickly-as-possible-
Transcribed Image Text:A researcher designs an intervention to combat anti-Semitism. She also designs a questionnaire to measure anti-Semitism so she can test the
participants' level of anti-Semitism before and after the intervention. She tests one version of her questionnaire with 45 statements and a shorter version
with 12 statements. In both questionnaires, the participants respond to each statement with a rating on a 5-point Likert scale with O equaling "strongly
disagree" and 4 equaling "strongly agree." The overall score for each participant is the mean of his or her ratings for the different statements on the
questionnaire.
Look at the following graphs. Graph I graphs the results from the short version, and Graph II graphs the results from the long version.
PARTICIPANTS
PARTICIPANTS
8
7
6
5
Àn
4
3
2
1
0
SHORT QUESTIONNAIRE SCORE
8
7
6
5
4
3
2
1
0
Graph I
1
2
3
Graph II
1
2
3
4
LONG QUESTIONNAIRE SCORE
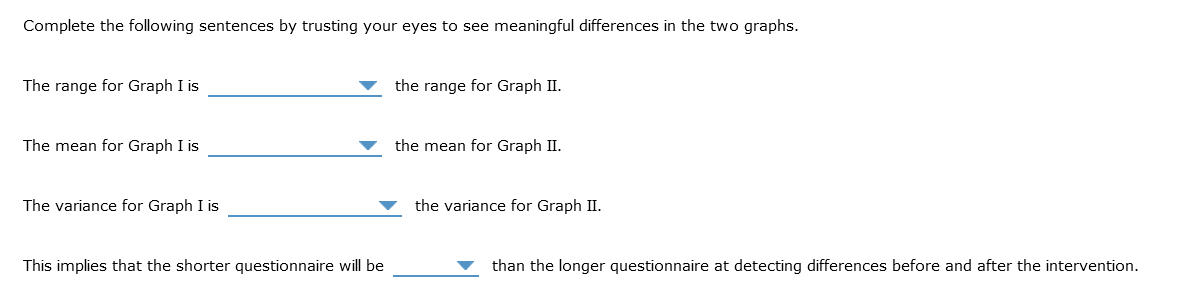
Transcribed Image Text:Complete the following sentences by trusting your eyes to see meaningful differences in the two graphs.
The range for Graph I is
The mean for Graph I is
The variance for Graph I is
This implies that the shorter questionnaire will be
the range for Graph II.
the mean for Graph II.
the variance for Graph II.
than the longer questionnaire at detecting differences before and after the intervention.
Expert Solution
This question has been solved!
Explore an expertly crafted, step-by-step solution for a thorough understanding of key concepts.

This is a popular solution!

Trending now
This is a popular solution!

Step by step
Solved in 2 steps

Recommended textbooks for you
Holt Mcdougal Larson Pre-algebra: Student Edition…
Algebra
ISBN:
9780547587776
Author:
HOLT MCDOUGAL
Publisher:
HOLT MCDOUGAL

College Algebra
Algebra
ISBN:
9781305115545
Author:
James Stewart, Lothar Redlin, Saleem Watson
Publisher:
Cengage Learning
Holt Mcdougal Larson Pre-algebra: Student Edition…
Algebra
ISBN:
9780547587776
Author:
HOLT MCDOUGAL
Publisher:
HOLT MCDOUGAL
College Algebra
Algebra
ISBN:
9781305115545
Author:
James Stewart, Lothar Redlin, Saleem Watson
Publisher:
Cengage Learning