A researcher hypothesized that children's cholesterol levels may be affected by educating their parents on proper nutrition and exercise. A random sample of 40 families with a child between the ages of 10 to 15 who had been diagnosed with high cholesterol were recruited to participate in the study. All parents were provided with educational information on nutrition and exercise. After following the prescribed program, the child's total cholesterol was measured. The children's (the sample) mean cholesterol level was 185 with a standard deviation of 19.5. Is there significant evidence of that their cholesterol level after this intervention is lower than the population mean of 191?
A researcher hypothesized that children's cholesterol levels may be affected by educating their parents on proper nutrition and exercise. A random sample of 40 families with a child between the ages of 10 to 15 who had been diagnosed with high cholesterol were recruited to participate in the study. All parents were provided with educational information on nutrition and exercise. After following the prescribed program, the child's total cholesterol was measured. The children's (the sample) mean cholesterol level was 185 with a standard deviation of 19.5. Is there significant evidence of that their cholesterol level after this intervention is lower than the population mean of 191?

Glencoe Algebra 1, Student Edition, 9780079039897, 0079039898, 2018
18th Edition
ISBN:9780079039897
Author:Carter
Publisher:Carter
Chapter10: Statistics
Section10.3: Measures Of Spread
Problem 1GP

Related questions
Question
c. Complete the analysis (be sure to include graphs as appropriate to the test). Show me calculations and results from excel.
d. What is the interpretation of your results?
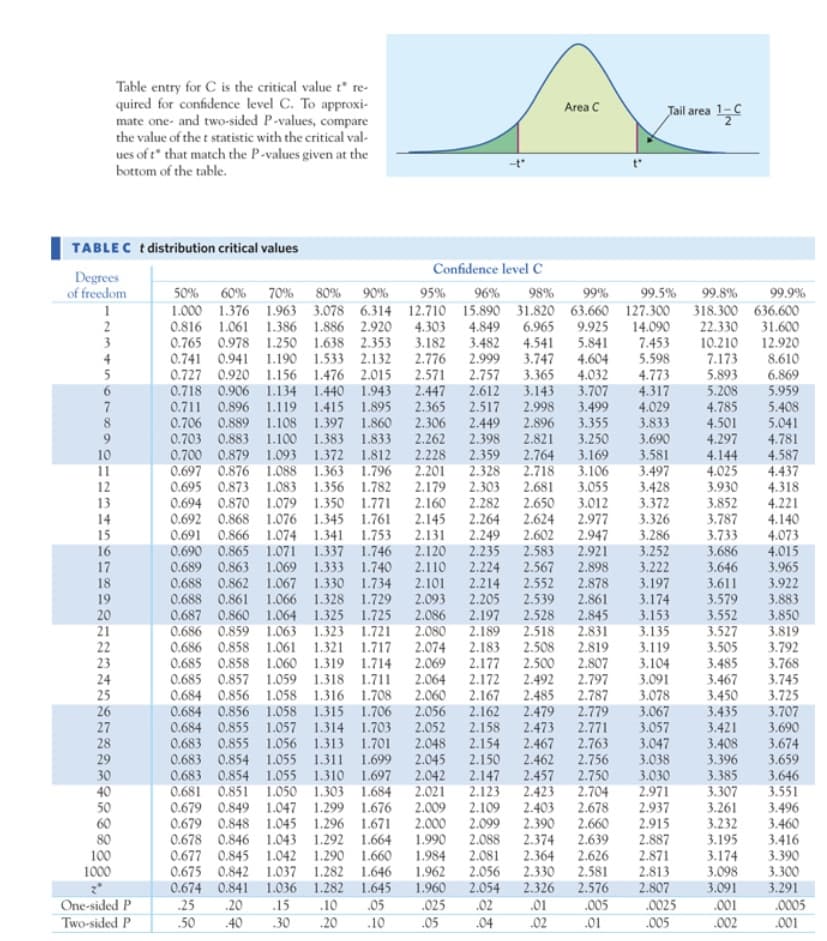
Transcribed Image Text:Table entry for C is the critical value t* re-
quired for confidence level C. To approxi-
mate one- and two-sided P-values, compare
the value of the t statistic with the critical val-
Jail area 1C
Area C
ues of t" that match the P-values given at the
bottom of the table.
TABLEC t distribution critical values
Confidence level c
Degrees
of freedom
50%
60%
70%
80%
90%
95%
96%
98%
99%
99.5%
99.8%
99.9%
1.000 1.376 1.963 3.078 6.314 12.710 15.890 31.820 63.660 127.300
0.816 1.061 1.386 1.886 2.920
0.765 0.978 1.250 1.638 2.353
0.741 0.941 1.190 1.533 2.132
4.303
3.182
2.776
4.849
3.482
2.999
2.757
2.612
318.300 636.600
22.330
10.210
7.173
2
3
6.965
9.925
5.841
4.604
4.032
3.707
3.499
3.355
4.541
3.747
3.365
14.090
7.453
5.598
31.600
12.920
8.610
4
5
0.727 0.920 1.156 1.476 2.015
0.718 0.906 1.134 1.440 1.943
0.711 0.896 1.119 1.415 1.895
0.706 0.889 1.108 1.397 1.860
0.703 0.883 1.100 1.383 1.833
2.571
2.447
2.365
2.306
2.262
2.228
2.201
2.179
2.160
4.773
4.317
4.029
3.833
5.893
6.869
3.143
2.998
2.896
2.821
5.208
5.959
4.785
4.501
4.297
4.144
4.025
3.930
3.852
5.408
5.041
4.781
4.587
4.437
4.318
4.221
4.140
4.073
4.015
3.965
3.922
7
2.517
2.449
2.398
2.359
2.328
2.303
9.
3.250
3.169
3.106
3.055
3.012
2.977
2.947
2.921
2.898
3.690
3.581
2.764
2.718
10
0.700 0.879 1.093 1.372 1.812
0.697 0.876 1.088 1.363 1.796
0.695 0.873 1.083 1.356 1.782
0.694 0.870 1.079 1.350 1.771
0.692 0.868 1.076 1.345 1.761
0.691 0.866 1.074 1.341 1.753
0.690 0.865 1.071 1.337 1.746
0.689 0.863 1.069 1.333 1.740
0.688 0.862 1.067 1.330 1.734
0.688 0.861
0.687 0.860 1.064 1.325 1.725
0.686 0.859 1.063 1.323 1.721
0.686 0.858 1.061 1.321 1.717
0.685 0.858 1.060 1.319 1.714
0.685 0.857 1.059 1.318 1.711
0.684 0.856 1.058 1.316 1.708
0.684 0.856 1.058 1.315 1.706
0.684 0.855 1.057 1.314 1.703
0.683 0.855 1.056 1.313 1.701
0.683 0.854 1.055 1.311 1.699
0.683 0.854 1.055 1.310 1.697
0.681 0.851 1.050 1.303 1.684
0.679 0.849 1.047 1.299 1.676
0.679 0.848 1.045 1.296 1.671
0.678 0.846 1.043 1.292 1.664
0.677 0.845 1.042 1.290 1.660
3.497
3.428
3.372
11
12
2.681
13
2.282
2.264
2.249
2.235
2.650
2.624
2.602
2.145
2.131
3.326
3.286
3.787
3.733
14
15
2.120
2.110
2.101
16
17
18
19
20
21
22
23
2.583
2.567
3.252
3.222
3.686
3.646
2.224
2.214
2.205
2.197
2.878
2.861
2.845
3.197
3.174
3.153
3.611
3.579
3.552
2.552
3.883
3.850
3.819
3.792
3.768
3.745
3.725
3.707
3.690
3.674
3.659
3.646
3.551
3.496
3.460
3.416
3.390
3.300
1.066 1.328 1.729
2.093
2.086
2.080
2.539
2.528
2.189
2.183
2.177
2.172
2.167
2.162
2.158
2.518
2.831
3.135
3.527
3.505
3.485
3.467
3.450
3.435
3.421
3.408
3.396
3.385
3.307
3.261
3.232
3.195
3.174
3.098
2.074
2.069
2.508
2.500
2.819
2.807
2.797
2.787
2.779
2.771
2.763
2.756
2.750
3.119
3.104
3.091
3.078
3.067
3.057
3.047
3.038
3.030
2.971
2.937
2.915
2.887
2.871
2.813
2.064
2.060
2.056
2.052
24
25
26
27
28
29
30
40
50
60
80
100
1000
2.492
2.485
2.479
2.473
2.467
2.462
2.457
2.423
2.403
2.390
2.374
2.364
2.330
2.326
.01
2.048
2.045
2.154
2.150
2.147
2.123
2.042
2.021
2.009
2.000
1.990
1.984
1.962
1.960
„025
2.109
2.099
2.088
2.081
2.056
2.054
2.704
2.678
2.660
2.639
2.626
2.581
0.675 0.842 1.037 1.282 1.646
0.674 0.841
.25
.20
1.036 1.282 1.645
.10
2.576
.005
2.807
.0025
„005
3.091
.001
3.291
.0005
.15
.05
.02
.04
One-sided P
Two-sided P
50
40
30
.20
.10
.05
.02
.01
.002
.001
Transcribed Image Text:A researcher hypothesized that children's cholesterol levels may
be affected by educating their parents on proper nutrition and
exercise. A random sample of 40 families with a child between
the ages of 10 to 15 who had been diagnosed with high
cholesterol were recruited to participate in the study. All parents
were provided with educational information on nutrition and
exercise. After following the prescribed program, the child's
total cholesterol was measured. The children's (the sample)
mean cholesterol level was 185 with a standard deviation of
19.5. Is there significant evidence of that their cholesterol level
after this intervention is lower than the population mean of 191?
Expert Solution
This question has been solved!
Explore an expertly crafted, step-by-step solution for a thorough understanding of key concepts.

This is a popular solution!

Trending now
This is a popular solution!

Step by step
Solved in 2 steps with 9 images

Recommended textbooks for you
Glencoe Algebra 1, Student Edition, 9780079039897…
Algebra
ISBN:
9780079039897
Author:
Carter
Publisher:
McGraw Hill

Holt Mcdougal Larson Pre-algebra: Student Edition…
Algebra
ISBN:
9780547587776
Author:
HOLT MCDOUGAL
Publisher:
HOLT MCDOUGAL

Big Ideas Math A Bridge To Success Algebra 1: Stu…
Algebra
ISBN:
9781680331141
Author:
HOUGHTON MIFFLIN HARCOURT
Publisher:
Houghton Mifflin Harcourt
Glencoe Algebra 1, Student Edition, 9780079039897…
Algebra
ISBN:
9780079039897
Author:
Carter
Publisher:
McGraw Hill
Holt Mcdougal Larson Pre-algebra: Student Edition…
Algebra
ISBN:
9780547587776
Author:
HOLT MCDOUGAL
Publisher:
HOLT MCDOUGAL
Big Ideas Math A Bridge To Success Algebra 1: Stu…
Algebra
ISBN:
9781680331141
Author:
HOUGHTON MIFFLIN HARCOURT
Publisher:
Houghton Mifflin Harcourt