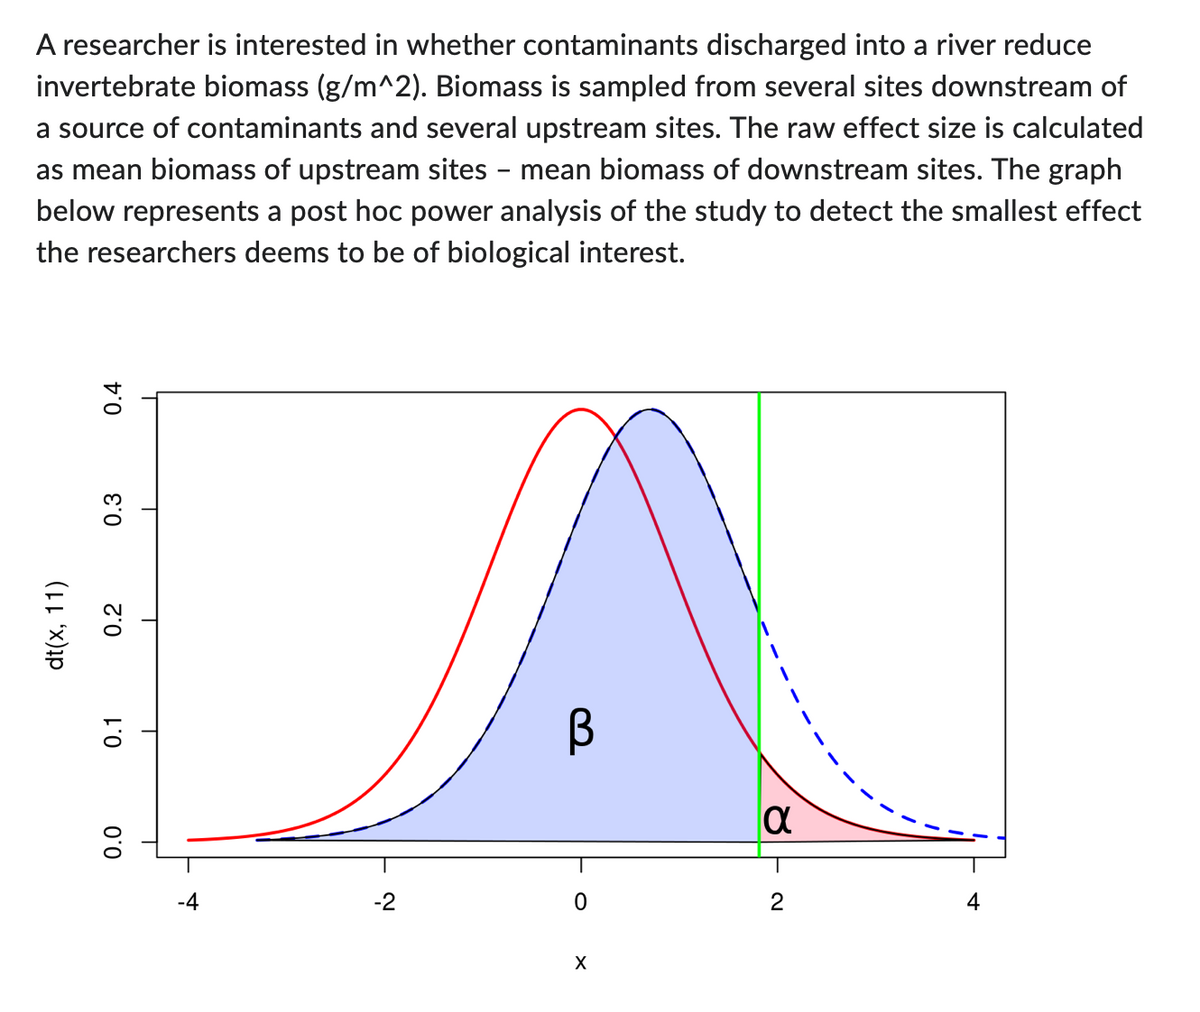
A researcher is interested in whether contaminants discharged into a river reduce invertebrate biomass (g/m^2). Biomass is sampled from several sites downstream of a source of contaminants and several upstream sites. The raw effect size is calculated as mean biomass of upstream sites - mean biomass of downstream sites. The graph below represents a post hoc power analysis of the study to detect the smallest effect the researchers deems to be of biological interest. dt(x, 11) 0.4 0.3 0.2 0.1 0.0 T T -4 -2 S 0 X α 2
A researcher is interested in whether contaminants discharged into a river reduce invertebrate biomass (g/m^2). Biomass is sampled from several sites downstream of a source of contaminants and several upstream sites. The raw effect size is calculated as mean biomass of upstream sites - mean biomass of downstream sites. The graph below represents a post hoc power analysis of the study to detect the smallest effect the researchers deems to be of biological interest. dt(x, 11) 0.4 0.3 0.2 0.1 0.0 T T -4 -2 S 0 X α 2

Chapter3: Functions
Section3.3: Rates Of Change And Behavior Of Graphs
Problem 1SE: Can the average rate of change of a function be constant?

Related questions
Question
URGENT PLEASE ANSWER ASAP
What is the null hypothesis given the way the solid green line is drawn on the graph?
Transcribed Image Text:A researcher is interested in whether contaminants discharged into a river reduce
invertebrate biomass (g/m^2). Biomass is sampled from several sites downstream of
a source of contaminants and several upstream sites. The raw effect size is calculated
as mean biomass of upstream sites - mean biomass of downstream sites. The graph
below represents a post hoc power analysis of the study to detect the smallest effect
the researchers deems to be of biological interest.
dt(x, 11)
0.4
0.3
0.2
0.1
0.0
T
-4
-2
В
0
X
α
2
4
Expert Solution
This question has been solved!
Explore an expertly crafted, step-by-step solution for a thorough understanding of key concepts.

Step by step
Solved in 3 steps

Recommended textbooks for you