A researcher wanted to determine the number of televisions in households. He conducts a survey of 40 randomly selected households and obtains the data in the accompanying table, Complete parts (a) through (h) below m Click the icon to view the table of television counts (a) Are these data discrete or continuous? Explain O A. The given data are discrete because they can take on any real value Table of television counts OB The given data are continuous because they can take on any real value OC. The given data are continuous because they can only have whole number values OD. The given data are discrete because they can only have whole number values 0 32212130 32142132 (b) Construct a frequency distribution of the data. 21131 122 Televisions Frequency 2401 4521 24211 223 3. 4. Print Done (c) Construct a relative frequency distribution of the data Statcrunch Next
A researcher wanted to determine the number of televisions in households. He conducts a survey of 40 randomly selected households and obtains the data in the accompanying table, Complete parts (a) through (h) below m Click the icon to view the table of television counts (a) Are these data discrete or continuous? Explain O A. The given data are discrete because they can take on any real value Table of television counts OB The given data are continuous because they can take on any real value OC. The given data are continuous because they can only have whole number values OD. The given data are discrete because they can only have whole number values 0 32212130 32142132 (b) Construct a frequency distribution of the data. 21131 122 Televisions Frequency 2401 4521 24211 223 3. 4. Print Done (c) Construct a relative frequency distribution of the data Statcrunch Next

Glencoe Algebra 1, Student Edition, 9780079039897, 0079039898, 2018
18th Edition
ISBN:9780079039897
Author:Carter
Publisher:Carter
Chapter10: Statistics
Section10.1: Measures Of Center
Problem 14PPS

Related questions
Question
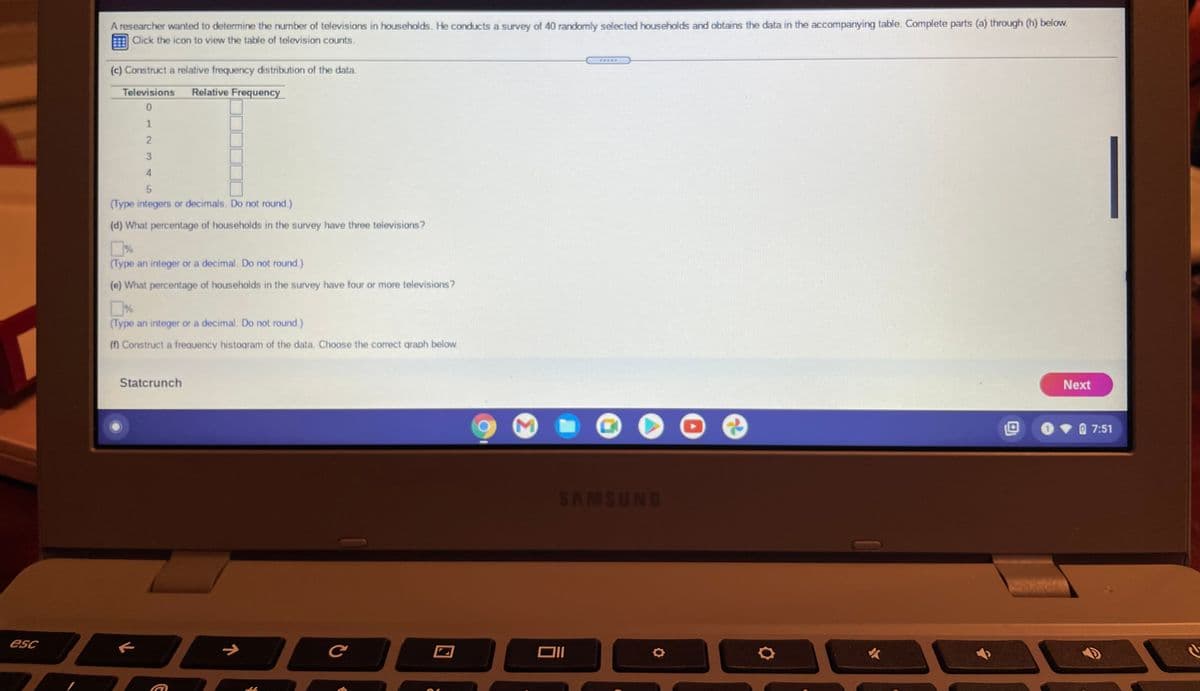
Transcribed Image Text:A researcher wanted to determine the number of televisions in households. He conducts a survey of 40 randomly selected households and obtains the data in the accompanying table. Complete parts (a) through (h) below.
Click the icon to view the table of television counts.
(c) Construct a relative frequency distribution of the data.
Televisions
Relative Frequency
1
3
4
5
(Type integers or decimals. Do not round.)
(d) What percentage of households in the survey have three televisions?
(Type an integer or a decimal. Do not round.)
(e) What percentage of households in the survey have four or more televisions?
(Type an integer or a decimal. Do not round.)
(f) Construct a frequency histogram of the data. Choose the correct graph below.
Statcrunch
Next
7:51
SAMSUNG
esc
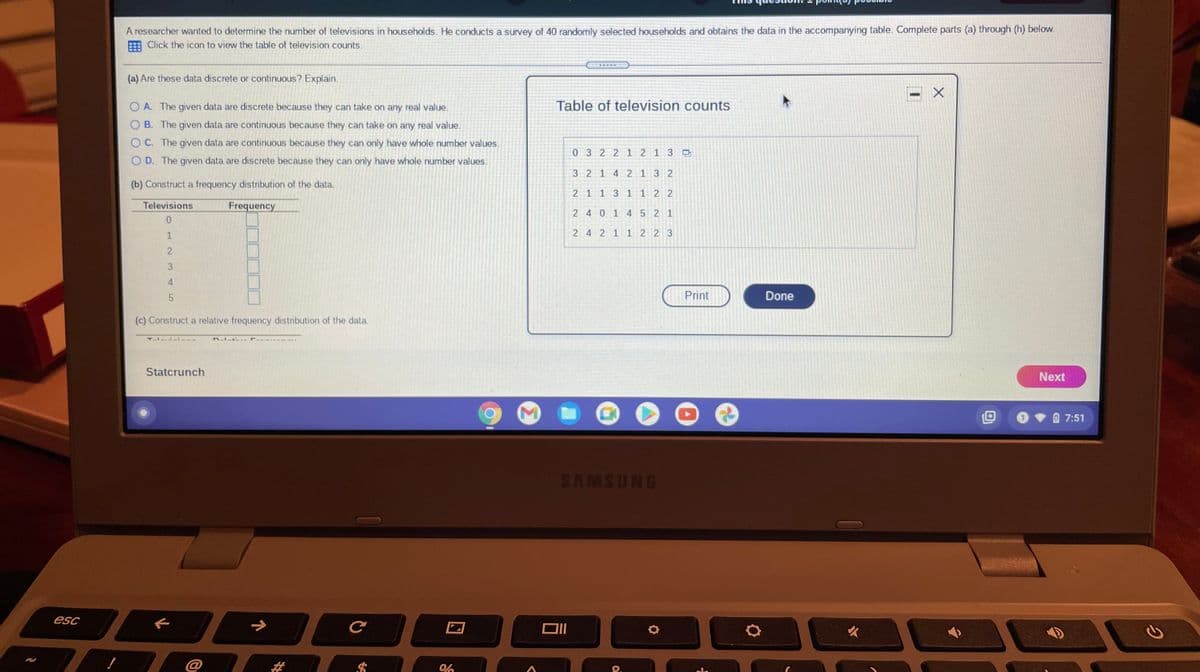
Transcribed Image Text:A researcher wanted to determine the number of televisions in households. He conducts a survey of 40 randomly selected households and obtains the data in the accompanying table. Complete parts (a) through (h) below.
E Click the icon to view the table of television counts.
(a) Are these data discrete or continuous? Explain.
O A. The given data are discrete because they can take on any real value.
Table of television counts
O B. The given data are continuous because they can take on any real value.
O C. The given data are continuous because they can only have whole number values.
0 3 2 2 1 2 1 3
O D. The given data are discrete because they can only have whole number values.
3 2 1 4 2 1 3 2
(b) Construct a frequency distribution of the data.
2 1 1 3 1 1 2 2
Televisions
Frequency
2 40 1 4 5 2 1
2 4 2 1 1 2 2 3
3
4.
Print
Done
(c) Construct a relative frequency distribution of the data.
Statcrunch
Next
0•0 7:51
SAMSUNG
esc
Expert Solution
This question has been solved!
Explore an expertly crafted, step-by-step solution for a thorough understanding of key concepts.

This is a popular solution!

Trending now
This is a popular solution!

Step by step
Solved in 2 steps

Recommended textbooks for you
Glencoe Algebra 1, Student Edition, 9780079039897…
Algebra
ISBN:
9780079039897
Author:
Carter
Publisher:
McGraw Hill

Holt Mcdougal Larson Pre-algebra: Student Edition…
Algebra
ISBN:
9780547587776
Author:
HOLT MCDOUGAL
Publisher:
HOLT MCDOUGAL
Glencoe Algebra 1, Student Edition, 9780079039897…
Algebra
ISBN:
9780079039897
Author:
Carter
Publisher:
McGraw Hill
Holt Mcdougal Larson Pre-algebra: Student Edition…
Algebra
ISBN:
9780547587776
Author:
HOLT MCDOUGAL
Publisher:
HOLT MCDOUGAL