A researcher wants to see how men and women differ in their reaction to a headache medicine with respect to drowsiness. In
A researcher wants to see how men and women differ in their reaction to a headache medicine with respect to drowsiness. In

Algebra & Trigonometry with Analytic Geometry
13th Edition
ISBN:9781133382119
Author:Swokowski
Publisher:Swokowski
Chapter11: Topics From Analytic Geometry
Section11.4: Plane Curves And Parametric Equations
Problem 44E

Related questions

Topic Video
Question
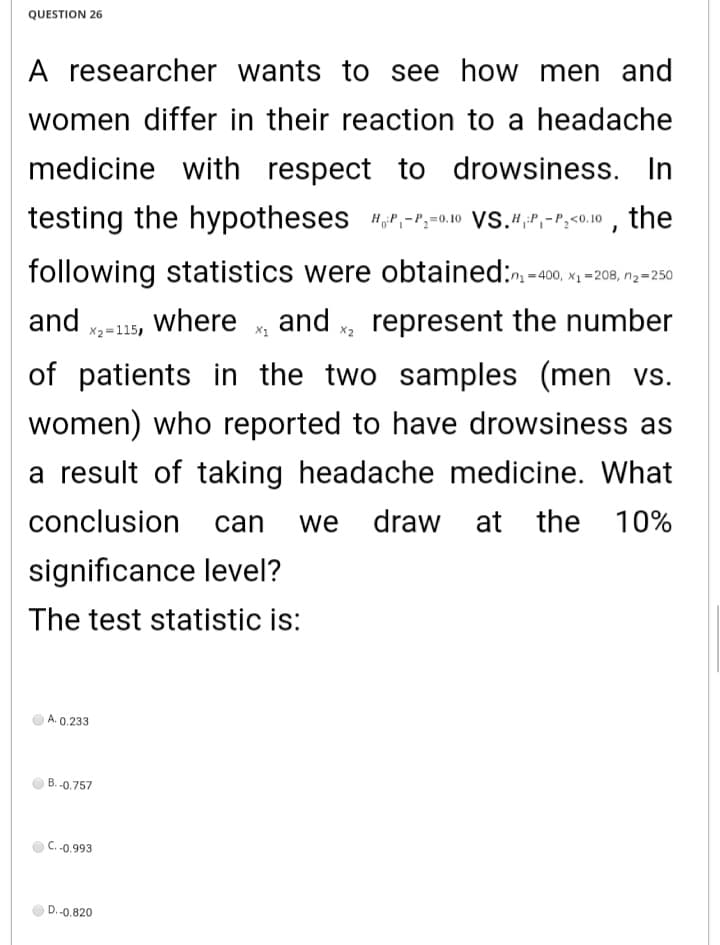
Transcribed Image Text:QUESTION 26
A researcher wants to see how men and
women differ in their reaction to a headache
medicine with respect to drowsiness. In
testing the hypotheses "P,-r,-0.10 VS.4,P,-P;<o.10 , the
following statistics were obtained:. -10 x -208, n--250
and -15, where
and x, represent the number
X2=115,
of patients in the two samples (men vs.
women) who reported to have drowsiness as
a result of taking headache medicine. What
conclusion
can
we
draw at the 10%
significance level?
The test statistic is:
A. 0.233
B. -0.757
C. -0.993
D.-0,820
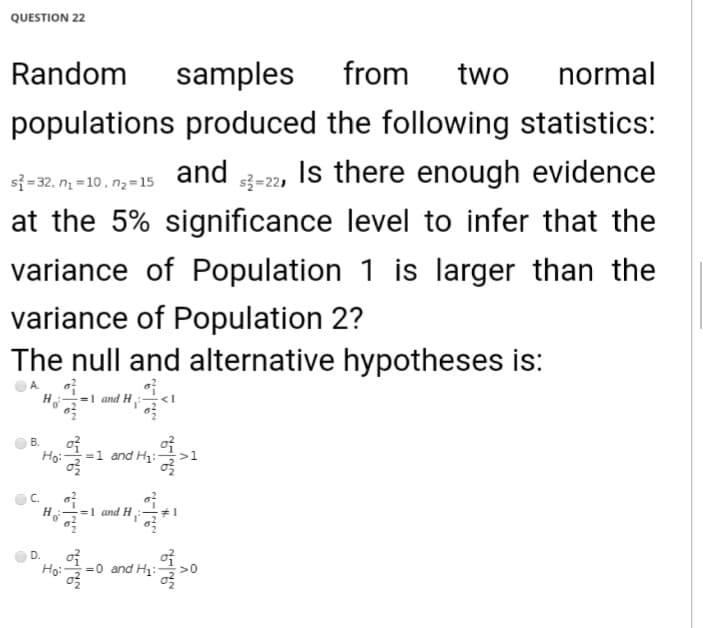
Transcribed Image Text:QUESTION 22
Random
samples
from
two
normal
populations produced the following statistics:
si=32, n = 10, n2=15
and -2, Is there enough evidence
at the 5% significance level to infer that the
variance of Population 1 is larger than the
variance of Population 2?
The null and alternative hypotheses is:
H-
and H
B.
Ho:-
=1 and H:
C.
H
=1 and H:
D.
Ho:
=0 and H:-
Expert Solution
This question has been solved!
Explore an expertly crafted, step-by-step solution for a thorough understanding of key concepts.

This is a popular solution!

Trending now
This is a popular solution!

Step by step
Solved in 3 steps

Knowledge Booster


Learn more about
Need a deep-dive on the concept behind this application? Look no further. Learn more about this topic, statistics and related others by exploring similar questions and additional content below.Recommended textbooks for you
Algebra & Trigonometry with Analytic Geometry
Algebra
ISBN:
9781133382119
Author:
Swokowski
Publisher:
Cengage

Trigonometry (MindTap Course List)
Trigonometry
ISBN:
9781337278461
Author:
Ron Larson
Publisher:
Cengage Learning

Trigonometry (MindTap Course List)
Trigonometry
ISBN:
9781305652224
Author:
Charles P. McKeague, Mark D. Turner
Publisher:
Cengage Learning
Algebra & Trigonometry with Analytic Geometry
Algebra
ISBN:
9781133382119
Author:
Swokowski
Publisher:
Cengage
Trigonometry (MindTap Course List)
Trigonometry
ISBN:
9781337278461
Author:
Ron Larson
Publisher:
Cengage Learning
Trigonometry (MindTap Course List)
Trigonometry
ISBN:
9781305652224
Author:
Charles P. McKeague, Mark D. Turner
Publisher:
Cengage Learning