A researcher was interested in comparing the response times of two different cab companies. Companies A and B were each called at 30 randomly selected times. The calls to company A were made independentiy of the calls to company B. The response times were recorded and the summary statistics were as follows: Company A Company B Mean response time 7.6 mins 6.9 mins Standard deviation 32 mins 1.4 mins Use Table A-3 to find the critical value, t, to test, at a = 1%, the claim that the mean response time for company A differs from the mean response time for company B. Round your answer to three decimal places. Answer: A researcher was interested in comparing the resting pulse rates of people who exercise regulariy and the pulse rates of those who do not exercise regularly.
A researcher was interested in comparing the response times of two different cab companies. Companies A and B were each called at 30 randomly selected times. The calls to company A were made independentiy of the calls to company B. The response times were recorded and the summary statistics were as follows: Company A Company B Mean response time 7.6 mins 6.9 mins Standard deviation 32 mins 1.4 mins Use Table A-3 to find the critical value, t, to test, at a = 1%, the claim that the mean response time for company A differs from the mean response time for company B. Round your answer to three decimal places. Answer: A researcher was interested in comparing the resting pulse rates of people who exercise regulariy and the pulse rates of those who do not exercise regularly.

Glencoe Algebra 1, Student Edition, 9780079039897, 0079039898, 2018
18th Edition
ISBN:9780079039897
Author:Carter
Publisher:Carter
Chapter10: Statistics
Section10.4: Distributions Of Data
Problem 19PFA

Related questions
Question
D1)
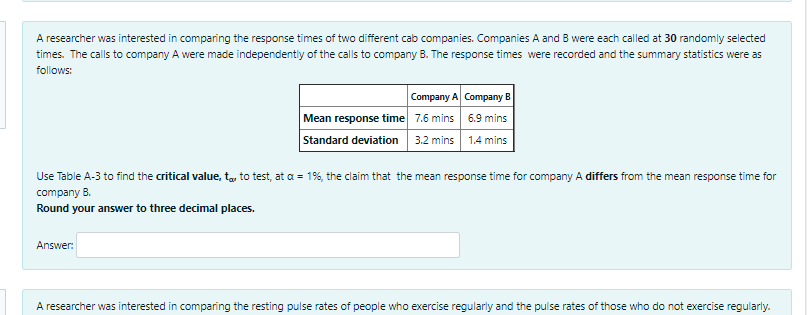
Transcribed Image Text:A researcher was interested in comparing the response times of two different cab companies. Companies A and B were each called at 30 randomly selected
times. The calls to company A were made independently of the calls to company B. The response times were recorded and the summary statistics were as
follows:
Company A Company B
Mean response time 7.6 mins 6.9 mins
Standard deviation 3.2 mins 1.4 mins
Use Table A-3 to find the critical value, ta, to test, at a = 1%, the claim that the mean response time for company A differs from the mean response time for
company B.
Round your answer to three decimal places.
Answer:
A researcher was interested in comparing the resting pulse rates of people who exercise regularly and the pulse rates of those who do not exercise regularly.
Expert Solution
This question has been solved!
Explore an expertly crafted, step-by-step solution for a thorough understanding of key concepts.

This is a popular solution!

Trending now
This is a popular solution!

Step by step
Solved in 2 steps with 2 images

Recommended textbooks for you
Glencoe Algebra 1, Student Edition, 9780079039897…
Algebra
ISBN:
9780079039897
Author:
Carter
Publisher:
McGraw Hill
Glencoe Algebra 1, Student Edition, 9780079039897…
Algebra
ISBN:
9780079039897
Author:
Carter
Publisher:
McGraw Hill