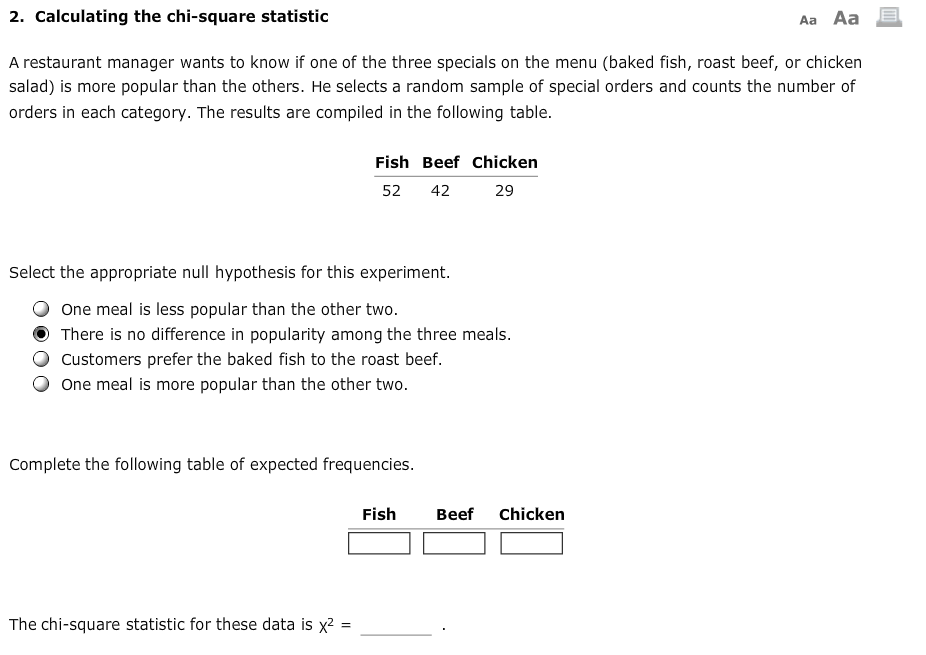
A restaurant manager wants to know if one of the three specials on the menu (baked fish, roast beef, or chicken salad) is more popular than the others. He selects a random sample of special orders and counts the number of orders in each category. The results are compiled in the following table. Fish Beef Chicken 52 42 29 Select the appropriate null hypothesis for this experiment. One meal is less popular than the other two. There is no difference in popularity among the three meals. Customers prefer the baked fish to the roast beef. One meal is more popular than the other two. Complete the following table of expected frequencies. Fish Beef Chicken The chi-square statistic for these data is x?
A restaurant manager wants to know if one of the three specials on the menu (baked fish, roast beef, or chicken salad) is more popular than the others. He selects a random sample of special orders and counts the number of orders in each category. The results are compiled in the following table. Fish Beef Chicken 52 42 29 Select the appropriate null hypothesis for this experiment. One meal is less popular than the other two. There is no difference in popularity among the three meals. Customers prefer the baked fish to the roast beef. One meal is more popular than the other two. Complete the following table of expected frequencies. Fish Beef Chicken The chi-square statistic for these data is x?

College Algebra
7th Edition
ISBN:9781305115545
Author:James Stewart, Lothar Redlin, Saleem Watson
Publisher:James Stewart, Lothar Redlin, Saleem Watson
Chapter9: Counting And Probability
Section9.3: Binomial Probability
Problem 1E: A binomial experiment is UDC in which there are exactly __________ outcome. One outcome is called...

Related questions
Topic Video
Question
100%
Transcribed Image Text:A restaurant manager wants to know if one of the three specials on the menu (baked fish, roast beef, or chicken
salad) is more popular than the others. He selects a random sample of special orders and counts the number of
orders in each category. The results are compiled in the following table.
Fish Beef Chicken
52
42
29
Select the appropriate null hypothesis for this experiment.
One meal is less popular than the other two.
There is no difference in popularity among the three meals.
Customers prefer the baked fish to the roast beef.
One meal is more popular than the other two.
Complete the following table of expected frequencies.
Fish
Beef
Chicken
The chi-square statistic for these data is x?
Expert Solution
This question has been solved!
Explore an expertly crafted, step-by-step solution for a thorough understanding of key concepts.

This is a popular solution!

Trending now
This is a popular solution!

Step by step
Solved in 4 steps with 7 images

Knowledge Booster


Learn more about
Need a deep-dive on the concept behind this application? Look no further. Learn more about this topic, statistics and related others by exploring similar questions and additional content below.Recommended textbooks for you
College Algebra
Algebra
ISBN:
9781305115545
Author:
James Stewart, Lothar Redlin, Saleem Watson
Publisher:
Cengage Learning
College Algebra
Algebra
ISBN:
9781305115545
Author:
James Stewart, Lothar Redlin, Saleem Watson
Publisher:
Cengage Learning