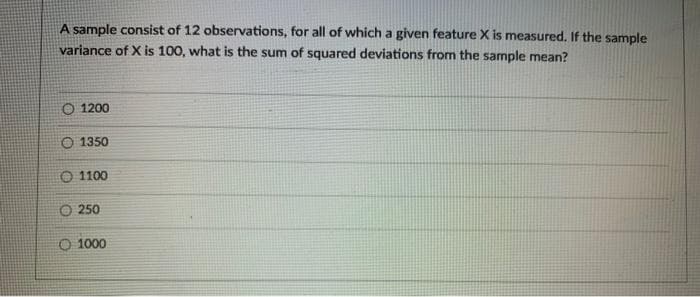
A sample consist of 12 observations, for all of which a given feature X is measured. If the sample variance of X is 100, what is the sum of squared deviations from the sample mean? O 1200 O 1350 O 1100 O 250 O 1000


Q: Which one of the following statements is not true as OLS assumptions? O a. The variance of the…
A: Option b is the correct assumption as the residual term should have an expected mean zero for the…
Q: he variance of a sample of 81 observations equals 64. The candard deviation of the sample equals 8 O…
A: Since you have posted multiple questions, we will answer the first question for you. If you want the…
Q: Question 8 D A researcher's hypothesis is that the average length of salmon returning to spawn from…
A: Given: Population meanμ=24Sample size(n)=45Sample standard deviation(s)=3.1
Q: ..is the best measure of dispersion. .. Select one: Range a. b. Variance Standard Deviation с.
A: Solution: _______________ is the best measure of dispersion. a) Range b) Variance c) Standard…
Q: Engineers must consider the breadths of male heads when designing helmets. The company researchers…
A: Given: Sample mean = 6.6 Population standard deviation = 0.9
Q: Determine the sample variance and standard deviation for the following data. CI 10-14 F 15-19 20…
A: CI x f fx x (x-x) (x-x)2 f(x-x)2 10-14 12 5 60 23.25 -11.25 126.56 632.8 15-19 17 20 340 23.25…
Q: A sample of n = 16 scores has a mean of M = 56and a standard deviation of s = 12 . a. Explain what…
A: Given: The sample has following data. n= 16 hours Mean (M) = 56 Sample standard deviation (s) = 12
Q: &ll by adding 5 to each of the numbers in the set 36117 5 t we obtain the set 8, 11 , 6 , 12, 10…
A: The athematic mean is a method of calculating the average data, it is a good method of displaying…
Q: Having an extreme score in a sample (outliers) will NOT effect which of the following? standard…
A: The outliers don't influence the median value. This bodes well in light of the fact that the median…
Q: A sample size of 200 light bulbs was tested and found that 11 were defective. What is the 95%…
A: Answer in step 2 Note please post second question seperately. Thankyou
Q: (26) A company is interested in determining whether the average life of HP and Epson printers is…
A: In order to check if the means average lives of HP and Epson printers are significantly different…
Q: 18. An insurance agent has claimed that the average age of policy-holders who insure through him…
A:
Q: Consider a sample with data values of 26, 24, 23, 15, 32, 36, 28, and 24. Compute the range,…
A: The range is the difference between the highest and lowest values. As the highest value rises then…
Q: A simple random sample of 37 rolling-and-wheeled backpacks being sold on Amazon had a mean price of…
A: As given sample size = 37 Mean price = $67.49 Population standard deviation = 14.33 Value of 90%…
Q: 2) You work for the FTC. A manufacturer of detergent claims that the mean weight of detergent is at…
A: The process by which we decide if a certain hypothesis is true or not is called the test of…
Q: The mean was found to be u = 70 so now we need to find the standard deviation o. The standard…
A: Standard deviation is a measure of spread of data around mean of the data. Higher the standard…
Q: SCCoast, an Internet provider in the Southeast, developed the following frequency distribution on…
A: The mean and standard deviation can be calculated by using the table below. ClassMid-point…
Q: An econometrics class has 80 students, and the mean student weight is145 lb. A random sample of 4…
A: If a random sample is taken, as the sample gets larger the probability the average weight is equal…
Q: The mean of a certain normal distribution is equal to the standard deviation of the sample mean of a…
A: Given: Let μ be population meanμ be population mean σ be the population standard deviation Given:…
Q: Given the following statistics, calculate the lower bound (value) for the 95% Confidence Interval…
A: As given data A bar = 9.2 Standard deviation = 1.8 N = 784.
Q: The distribution of annual profit at a chain of stores was approximately normal with mean u =…
A: μ=66000σ=21000
Q: d What is the probability that the sample mean exceeds 104.67 P(X> 104.6) - (Round to four decimal…
A: The given distribution follow normal distribution with n =9 sample size with the help of sample mean…
Q: After every score in a sample is divided by 3, the mean is calculated and found to be M = 7. What…
A: Actual Mean Value = New mean value (after every sample is divided…
Q: A sample of 60 observations will be taken from an infinite population. The population proportion…
A: Given that, Sample observations (n ) = 60 population proportion (p) = 0.85
Q: Problems-2: The following data shows birth weights (oz) from seven consecutive deliveries at the…
A: Given: 5,121,138,32,100,58,64
Q: A study compared grade point averages (GPA) for students in a class: students were divided by 6…
A: Given: Sum of squared errors (SSE) = 50 Number of observations (n) = 12 Number of treatments (k) = 6
Q: A courier company guarantees its customers that the average time to pick up their packages is 20…
A: Process capability index is a statistical tool that measures the ability of any process to produce…
Q: A random sample of residents from various income brackets was asked their opinion on tax reform for…
A:
Q: For the Given values of 56, 67.9, 68, 53.8 and 69.8, Calculate a) Mean b) Algebraic Sum of…
A: We have individual series : 56, 67.9, 68, 53.8 and 69.8 First of all , I will arrange this in…
Q: af the sampled population has a mean of 48 and standard deviation of 16, then respectively the mean…
A: Correlation coefficient - It is the measure of correlation that is present between two variables is…
Q: The variance of sample means is:
A: To find : Variance of sample given.
Q: Consider the hypotheses below. Ho: p = 50 H: µz 50 Given that x= 55, s 8, n D20, and a =0.10, answer…
A: We have given that H0 = 50HA ≠50 x¯= 55, s = 8, n= 20 and α =0.10 We have to check which…
Q: Suppose you randomly select a sample of 16 observations from a population with u = 8and o = 2You…
A: Number of observations = 16 μ = 8δ = 2x¯ = 7
Q: Consider the following hypothesis test Η με 20 H₁ μ<20 A sample of 80 gave a sample mean of 19.4.…
A: We have been given sample of 80 which gives sample mean of 19.4. Standard deviation of population is…
Q: onsider the following data: −11,−5,−5,−11,13,−11,−5−11,−5,−5,−11,13,−11,−5 Copy Data Step 2 of 3:…
A:
Q: Given the following data .Find the OLS estimators using the deviation method. Y 6 10 9 14 7 5 X1…
A: Y X1 X2 6 1 3 10 3 -1 9 2 4 14 -2 6 7 3 2 5 5 4 Using excel, we get the regression…
Q: 2. Suppose the sample size n=10, we have the following figures for sample data: ΣΥ-1110 ΣΧ-163 ;…
A: We can find out the OLS regressor using the formula's of b0 and b1
Q: sume that the population proportion is 0.60. Compute the standard error of the proportion, o-, for…
A: Given that, Population proportion (P) = 0.60 1-P = 1-0.60 = 0.4
Q: MY NOTES ASK YOUR TEACHER 9. DETAILS ASWESBE9 8.TB.1.021. 0/1 Submissions Used In order to estimate…
A: The standard error of mean shows the standard deviation of the statistical sample population. The…
Q: d) Suppose this is a representative sample of births in a given year at Johns Hopkins. Suppose,…
A: Given: Sample size = 100 Sample size = 7
Q: Let (X1,. Xn) be an i.i.d. sample from X, where Var(X) < 00. Suppose you wish to estimate E[X], and…
A: * SOLUTION :- (4) The OPTION is TRUE is correct answer. Based on the given information the…
Q: government study among adults in the 25- to 34-year age group, the mean amount spent per year on…
A:
Q: The Class 2 group for the next Boy's and Girt's Championships female 100m dash has 56 females…
A: Given , X follows a normal distribution mean , μ=23variance, σ2=169standard devaition,σ = 169=13.…
Q: 1. If the R-square (R2) = 0.4 and the sample size N = 11. Furthermore, suppose that the number of…
A: A regression model provides a function that describes the relationship between one or more…
Q: In a sample of 38 observations, you calculate a sample standard deviation of 6. To test Ho : o = 20…
A: A statistical hypothesis test is a strategy for statistical surmising used to decide a potential end…
Q: Every ten years, the census bureau asks people about the number of people living within their…
A: A. Below is the calculation for range. Range = Maximum value - Minimum valueRange = 6 - 1Range = 5
Q: A customer service team receives an average of 376 emails every day. Assume that the standard…
A: Given: Average = 376 Standard deviation = 96 Sample size = 40
Q: Question: It is known that the mean diameters of rivets produced by two firms A and B are…
A:
Q: A health expert evaluates the sleeping patterns of adults. Each week she randomly selects 40 adults…
A: * SOLUTION :-
6


Trending now
This is a popular solution!

Step by step
Solved in 2 steps with 1 images

- A total of 280 observations of Bob Ramos, an assembly-line worker, were made over a 40-hour work week. The sample also showed that Bob was busy working (assembling the parts) during o 230 bservations. (Round all intermediate calculations to at least two decimal places before proceeding with further calculations.) The number of observations that need to be taken of Bob to be 99% confident with 4% acceptablee error=19 The mean of z-scores in a data set a is zero only when the x-values are balanced around the mean of x. b is greater than zero for data sets that have large outlying values. c is always equal to one. d is always equal to zeroSCCoast, an Internet provider in the Southeast, developed the following frequency distribution on the age of Internet users. Find the mean and the standard deviation. (Round squared deviations to nearest whole number and final answer to 2 decimal places.) Age (years) Frequency 10 up to 20 3 20 up to 30 7 30 up to 40 18 40 up to 50 20 50 up to 60 12
- Given the following data .Find the OLS estimators using the deviation method. Y 6 10 9 14 7 5 X1 1 3 2 -2 3 5 X2 3 -1 4 6 2 4ASAP Exercise 7-48 (Algo) (LO7-3) According to a government study among adults in the 25- to 34-year age group, the mean amount spent per year on reading and entertainment is $2,125. Assume that the distribution of the amounts spent follows the normal distribution with a standard deviation of $439. (Round your z-score computation to 2 decimal places and final answers to 2 decimal places.) a. What percent of the adults spend more than $2,400 per year on reading and entertainment? b. What percent spend between $2,400 and $3,400 per year on reading and entertainment? c. What percent spend less than $1,000 per year on reading and entertainment?Consider the following data: −11,−5,−5,−11,13,−11,−5−11,−5,−5,−11,13,−11,−5 Copy Data Step 2 of 3: Calculate the value of the sample standard deviation. Round your answer to one decimal place.
- Calculate the sample size to study the average age of a Central State College student, plus or minus 0.4 years. We’d like to be 85% confident about our result. From a previous study, we know that the standard deviation for the population is 2.8.A random sample of residents from various income brackets was asked their opinion on tax reform for the country of Guyana. The data so gathered were analyzed by a statistician and the results he obtained using MINITAB are shown below: Expected counts are printed below observed counts Low Middle High Total For 26 (30.67) 75 (51.11) 14 (33.22) 115 Against 60 (69.33) 95 (115.56) 105 (**) 260 Neutral 34 (20) 30 (33.33) 11 (21.67) 75 Total * 200 130 450 Chi-sq = 0.71 + 11.17 + 11.12 + *** + 3.66 + 11.89 + 9.8 + 0.33 + 5.25 = 55.2 DF =??, p-value =??? Carefully define the null and alternative hypotheses of the x2 test underlying the generation of the above table. Find the missing values ‘*’, ‘**’, ‘***’, ‘??’ and ‘???’. What is the conclusion of this test? Give reasons for your answer.A sample of 20 observations from a normal distribution with standard deviation 4.51 gives amean of 32.8. Does this data support that the mean of the population is greater than 30 at0.05 significant level?
- Let x be a random variable representing dividend yield of Australian bank stocks. We mayassume that x has a normal distribution with σ = 2.4%. A random sample of 15 Australianbank stocks has a sample mean of x = 6.83%. For the entire Australian stock market, themean dividend yield is μ = 6.9%. Do these data indicate that the dividend yield of allAustralian bank stocks is higher than 6.9%? Use α = 0.05. What is the value of the teststatistic?What do you mean by Sample Variance, Sample Standard Deviation,and Standard Error?In your own words, describe what the difference is between an error term and a residual. How does sample size affect the variance of each?