A sample of 13 small bags of the same brand of candies was selected. Assume that the population distribution of bag weights is normal. The weight of each bag was then recorded. The mean weight was 3 ounces with a standard deviation of 0.15 ounces. The population standard deviation is known to be 0.1 ounce. NOTE: If you are using a Student's t-distribution, you may assume that the underlying population is normally distributed. (In general, you must first prove that assumption, though.) Part (a) O Part (b) O Part (e) O Part (d) O Part (e) Construct a 90% confidence interval for the population mean weight of the candies. () State the confidence interval. (Round your answers to three decimal places.) (ii) Sketch the graph.
A sample of 13 small bags of the same brand of candies was selected. Assume that the population distribution of bag weights is normal. The weight of each bag was then recorded. The mean weight was 3 ounces with a standard deviation of 0.15 ounces. The population standard deviation is known to be 0.1 ounce. NOTE: If you are using a Student's t-distribution, you may assume that the underlying population is normally distributed. (In general, you must first prove that assumption, though.) Part (a) O Part (b) O Part (e) O Part (d) O Part (e) Construct a 90% confidence interval for the population mean weight of the candies. () State the confidence interval. (Round your answers to three decimal places.) (ii) Sketch the graph.

Glencoe Algebra 1, Student Edition, 9780079039897, 0079039898, 2018
18th Edition
ISBN:9780079039897
Author:Carter
Publisher:Carter
Chapter10: Statistics
Section10.4: Distributions Of Data
Problem 19PFA

Related questions
Question
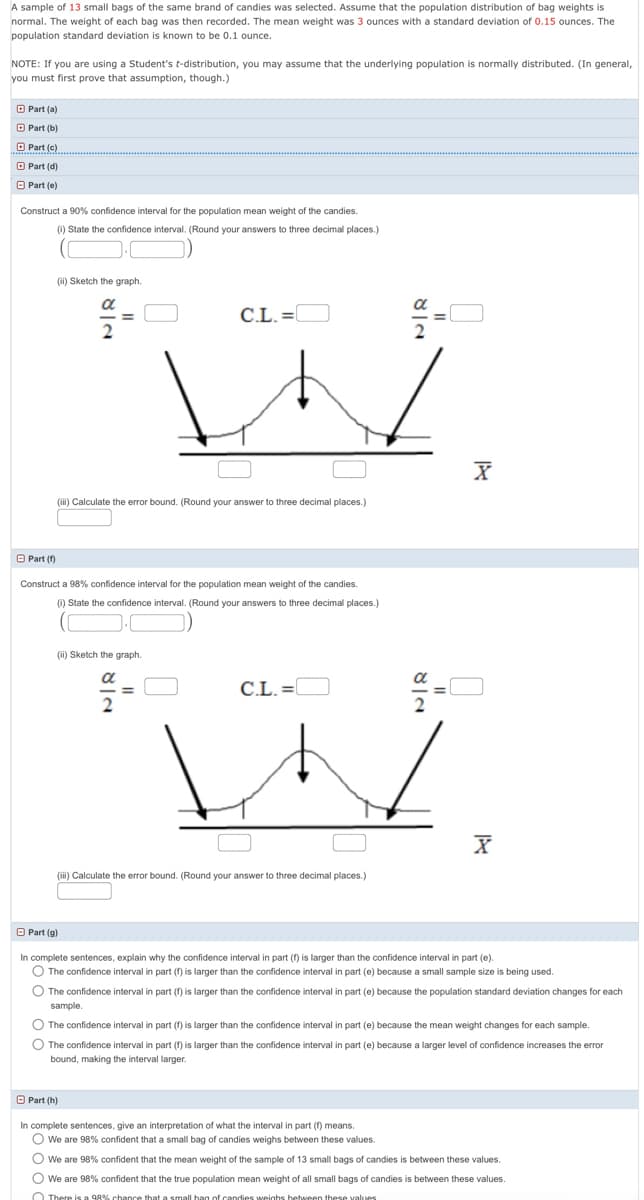
Transcribed Image Text:A sample of 13 small bags of the same brand of candies was selected. Assume that the population distribution of bag weights is
normal. The weight of each bag was then recorded. The mean weight was 3 ounces with a standard deviation of 0.15 ounces. The
population standard deviation is known to be 0.1 ounce.
NOTE: If you are using a Student's t-distribution, you may assume that the underlying population is normally distributed. (In general,
you must first prove that assumption, though.)
O Part (a)
O Part (b)
O Part (c)
O Part (d)
O Part (e)
Construct a 90% confidence interval for the population mean weight of the candies.
(1) State the confidence interval. (Round your answers to three decimal places.)
(i) Sketch the graph.
C.L. =l
(ii) Calculate the error bound. (Round your answer to three decimal places.)
O Part (f)
Construct a 98% confidence interval for the population mean weight of the candies.
(0) State the confidence interval. (Round your answers to three decimal places.)
(ii) Sketch the graph.
a
C.L. =
2
(i) Calculate the error bound. (Round your answer to three decimal places.)
O Part (g)
In complete sentences, explain why the confidence interval in part (f) is larger than the confidence interval in part (e).
O The confidence interval in part (f) is larger than the confidence interval in part (e) because a small sample size is being used.
O The confidence interval in part (f) is larger than the confidence interval in part (e) because the population standard deviation changes for each
sample.
O The confidence interval in part (f) is larger than the confidence interval in part (e) because the mean weight changes for each sample.
O The confidence interval in part (f) is larger than the confidence interval in part (e) because a larger level of confidence increases the error
bound, making the interval larger.
O Part (h)
In complete sentences, give an interpretation of what the interval in part (f) means.
O We are 98% confident that a small bag of candies weighs between these values.
O we are 98% confident that the mean weight of the sample of 13 small bags
candies is between these values.
O We are 98% confident that the true population mean weight of all small bags of candies is between these values.
O There is a 98% chance that a small hag of candies weinhs hetween these values
Expert Solution
This question has been solved!
Explore an expertly crafted, step-by-step solution for a thorough understanding of key concepts.

This is a popular solution!

Trending now
This is a popular solution!

Step by step
Solved in 4 steps with 6 images

Recommended textbooks for you
Glencoe Algebra 1, Student Edition, 9780079039897…
Algebra
ISBN:
9780079039897
Author:
Carter
Publisher:
McGraw Hill
Glencoe Algebra 1, Student Edition, 9780079039897…
Algebra
ISBN:
9780079039897
Author:
Carter
Publisher:
McGraw Hill