A sample of 26 offshore oil workers took part in a simulated escape exercise, resulting in the accompanying data on time (sec) to complete the escape. Here is a stem-and-leaf display of escape time data. stem leaf 32 55 33 49 34 35 6699 36 34469 37 03345 38 7 39 2347 40 23 41 42 8 (a) Determine the value of the fourth spread. (b) Are there any outliers in the sample? Any extreme outliers? O There are no extreme outliers but several outliers. O There are several extreme outliers. O There is one extreme outlier and one outlier. O There are no outliers or extreme outliers. O There is one extreme outlier and several outliers.
A sample of 26 offshore oil workers took part in a simulated escape exercise, resulting in the accompanying data on time (sec) to complete the escape. Here is a stem-and-leaf display of escape time data. stem leaf 32 55 33 49 34 35 6699 36 34469 37 03345 38 7 39 2347 40 23 41 42 8 (a) Determine the value of the fourth spread. (b) Are there any outliers in the sample? Any extreme outliers? O There are no extreme outliers but several outliers. O There are several extreme outliers. O There is one extreme outlier and one outlier. O There are no outliers or extreme outliers. O There is one extreme outlier and several outliers.

Holt Mcdougal Larson Pre-algebra: Student Edition 2012
1st Edition
ISBN:9780547587776
Author:HOLT MCDOUGAL
Publisher:HOLT MCDOUGAL
Chapter11: Data Analysis And Probability
Section11.4: Collecting Data
Problem 2E

Related questions
Question
P8
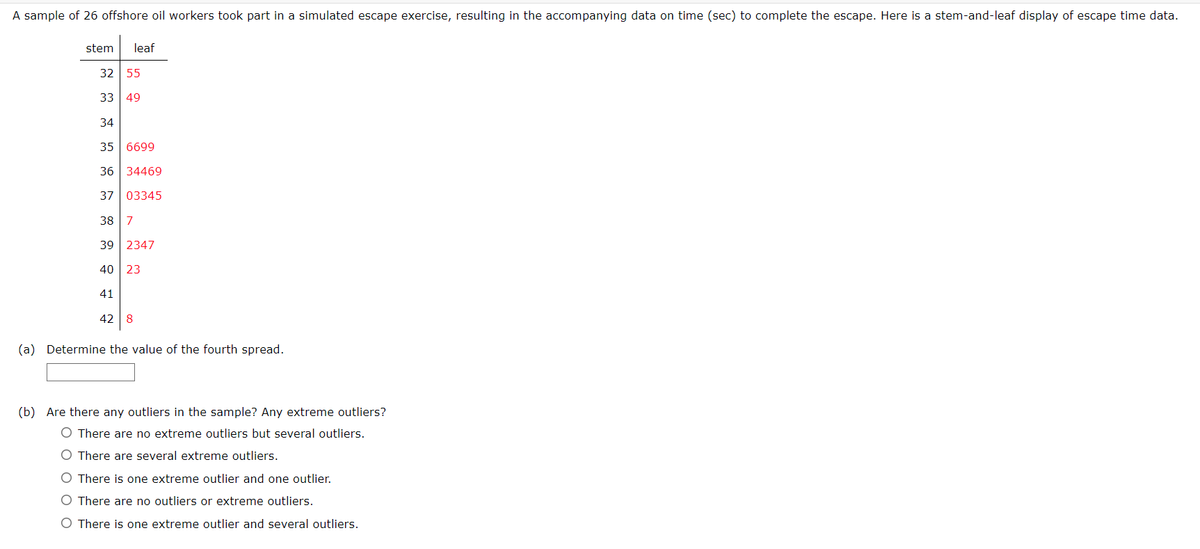
Transcribed Image Text:A sample of 26 offshore oil workers took part in a simulated escape exercise, resulting in the accompanying data on time (sec) to complete the escape. Here is a stem-and-leaf display of escape time data.
stem leaf
32 55
33 49
34
35 6699
36 34469
37 03345
38 7
39 2347
40 23
41
42 8
(a) Determine the value of the fourth spread.
(b) Are there any outliers in the sample? Any extreme outliers?
O There are no extreme outliers but several outliers.
O There are several extreme outliers.
O There is one extreme outlier and one outlier.
O There are no outliers or extreme outliers.
O There is one extreme outlier and several outliers.
Expert Solution
This question has been solved!
Explore an expertly crafted, step-by-step solution for a thorough understanding of key concepts.

This is a popular solution!

Trending now
This is a popular solution!

Step by step
Solved in 3 steps with 3 images

Recommended textbooks for you
Holt Mcdougal Larson Pre-algebra: Student Edition…
Algebra
ISBN:
9780547587776
Author:
HOLT MCDOUGAL
Publisher:
HOLT MCDOUGAL
Holt Mcdougal Larson Pre-algebra: Student Edition…
Algebra
ISBN:
9780547587776
Author:
HOLT MCDOUGAL
Publisher:
HOLT MCDOUGAL