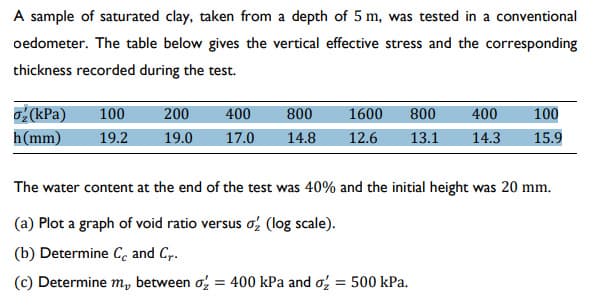
A sample of saturated clay, taken from a depth of 5 m, was tested in a conventional oedometer. The table below gives the vertical effective stress and the corresponding thickness recorded during the test. The water content at the end of the test was 40% and the initial height was 20 mm. (a) Plot a graph of void ratio versus ??′(log scale). (b) Determine ?? and ??. (c) Determine ?? between ??′ = 400 kPa and ??′ = 500 kPa. (d) Determine ???′ using Casagrande’s method.
A sample of saturated clay, taken from a depth of 5 m, was tested in a conventional oedometer. The table below gives the vertical effective stress and the corresponding thickness recorded during the test. The water content at the end of the test was 40% and the initial height was 20 mm. (a) Plot a graph of void ratio versus ??′(log scale). (b) Determine ?? and ??. (c) Determine ?? between ??′ = 400 kPa and ??′ = 500 kPa. (d) Determine ???′ using Casagrande’s method.
Principles of Geotechnical Engineering (MindTap Course List)
9th Edition
ISBN:9781305970939
Author:Braja M. Das, Khaled Sobhan
Publisher:Braja M. Das, Khaled Sobhan
Chapter12: Shear Strength Of Soil
Section: Chapter Questions
Problem 12.9P
Related questions
Question
A sample of saturated clay, taken from a depth of 5 m, was tested in a conventional
oedometer. The table below gives the vertical effective stress and the corresponding
thickness recorded during the test.
The water content at the end of the test was 40% and the initial height was 20 mm.
(a) Plot a graph of void ratio versus ??′(log scale).
(b) Determine ?? and ??.
(c) Determine ?? between ??′ = 400 kPa and ??′ = 500 kPa.
(d) Determine ???′ using Casagrande’s method.

Transcribed Image Text:A sample of saturated clay, taken from a depth of 5 m, was tested in a conventional
oedometer. The table below gives the vertical effective stress and the corresponding
thickness recorded during the test.
400
1600 800
100
₂(kPa) 100 200
800
400
h(mm) 19.2 19.0 17.0 14.8 12.6 13.1 14.3 15.9
The water content at the end of the test was 40% and the initial height was 20 mm.
(a) Plot a graph of void ratio versus o2 (log scale).
(b) Determine C, and Cr.
(c) Determine m, between o₂ = 400 kPa and o₂ = 500 kPa.
Expert Solution
This question has been solved!
Explore an expertly crafted, step-by-step solution for a thorough understanding of key concepts.
This is a popular solution!
Trending now
This is a popular solution!
Step by step
Solved in 4 steps with 1 images

Knowledge Booster
Learn more about
Need a deep-dive on the concept behind this application? Look no further. Learn more about this topic, civil-engineering and related others by exploring similar questions and additional content below.Recommended textbooks for you

Principles of Geotechnical Engineering (MindTap C…
Civil Engineering
ISBN:
9781305970939
Author:
Braja M. Das, Khaled Sobhan
Publisher:
Cengage Learning

Fundamentals of Geotechnical Engineering (MindTap…
Civil Engineering
ISBN:
9781305635180
Author:
Braja M. Das, Nagaratnam Sivakugan
Publisher:
Cengage Learning

Principles of Geotechnical Engineering (MindTap C…
Civil Engineering
ISBN:
9781305970939
Author:
Braja M. Das, Khaled Sobhan
Publisher:
Cengage Learning

Fundamentals of Geotechnical Engineering (MindTap…
Civil Engineering
ISBN:
9781305635180
Author:
Braja M. Das, Nagaratnam Sivakugan
Publisher:
Cengage Learning