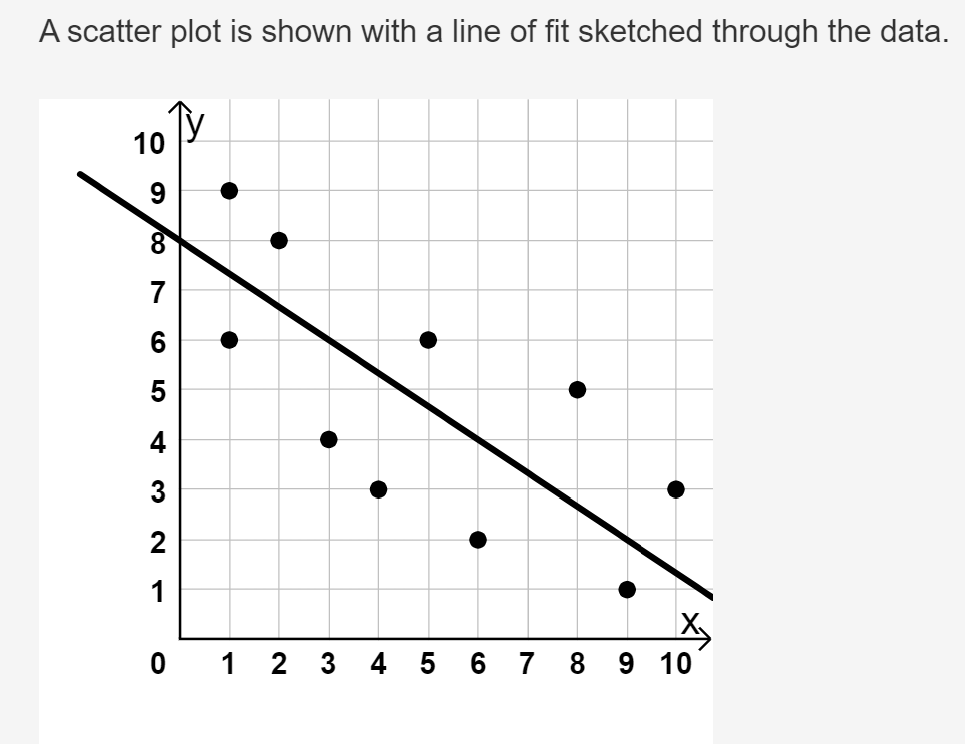
A scatter plot is shown with a line of fit sketched through the data. 10 9 8 7 6 5 4 3 2 1 ● ● X₂ 01 2 3 4 5 6 7 8 9 10


Q: The average labor charge for automobile mechanics is OMR 69 per hour. The standard deviation is OMR…
A: Given that the average labor charge for automobile mechanics is OMR 69 per hour. The standard…
Q: 13,6,−1,−12,9,−313,6,−1,−12,9,−3 Determine the median of the given data.
A: Eleven observations are given.The observations are 13, 6, −1, −12, 9, −313, 6, −1, −12, 9, −3.
Q: Numerical variables can be discrete or continuous. An example of a discrete variable is: O The…
A: The question is about types of variable.Introduction :Discrete variable :A variable which takes…
Q: b. Compute the row percentages (to 1 decimal).
A: Given that,y12TotalA505xB11213C21012Total181230To calculate the row percentage.
Q: The prevalence of osteoarthritis in the elderly among high-risk populations is approximately 6.3%.…
A: The objective of this question is to find the probability of identifying 20 or fewer cases of…
Q: Find the following sums for this small sample of data. X1 = 9 X2 = 0 Xg = 7 X4 = 4 Xg = 3 5 Find Σ…
A: The given values are:X1=9, X2=0, X3=7, X4=4, X5=3
Q: The brain volumes (cm³) of 20 brains have a mean of 1132.1 cm³ and a standard deviation of 120.6…
A: From the information, given thatThe formula for the significantly low and high values using the…
Q: Earnings functions attempt to find the determinants of earnings, using both continuous and binary…
A: No. of individuals on which data is collectedThe estimated relationship as the returns to…
Q: Problem 5 An EWMA control chart uses λ = 0.5. What is the value of L such that the steady state…
A: for the EWMA or Exponentially Weighted Moving Average chart.The L value must be determined such that…
Q: distributed with a mean of 80kg and a standard deviation of 10kg. The recruiting center wants to…
A: (2)The given data is as follows:YearCorn ProducedFertilizer…
Q: Suppose two candidates are running for the governor of California in 2022. We have the following…
A: The objective of the question is to analyze the poll data and answer the four sub-questions.
Q: Question 1 Let (Xn)nzo be a Markov chain with the state space S = {A, B, C, D, E, F} with the…
A: Given be a Markov chain with state space and the transition matrix:
Q: Let X1, . . . , Xn ∼ iid Gamma(3,1/θ) and we assume the prior for θ is InvGamma(10,2).(a) Find the…
A: The objective of the question is to find the posterior distribution for θ, the Bayes estimate under…
Q: Philanthropic organizations care about the return on their investment. For example, if a foundation…
A: The provided information is as follows:The total number of children is .The mean reduction in crimes…
Q: Approximately 18% of shoppers used cellphones to look for deals. THe probability of making a…
A: From the given information ,P ( cellphones) = 18% = 0.180.45
Q: Calculate the area to the right of 0.57 under the t-distribution with 17 degrees of freedom. Give…
A: Given information : Test statistic , t = 0.57Degrees of freedom , df = 17we have to find the area to…
Q: Between 1971 and 1975, as part of the National Health and Nutrition Examination Survey (NHANES),…
A: The information about the enrollment and the death of the diabetic and non-diabetic men and women is…
Q: 3. Check whether the following function is a valid pdf? If it is valid, obtain its CDF. If not…
A: The given function: It must be checked if it's a pdf or not along with the way to make it valid if…
Q: Kevin deposits a fixed quarterly amount into an annuity account for his child's college fund. He…
A: The objective of this question is to determine how much of the $90,000 Kevin will ultimately deposit…
Q: Find c such that the function f(x)= Oce range x>0.591. Select one: O O O a. 1.52952578 b. 0.94980704…
A:
Q: (a) Find the standard error of the mean for each sampling situation (assuming a normal population).…
A: A). σ=52 ,n=16
Q: in a national survey of 2013 randomly selected adults, 1283 indicated that they think that rudeness…
A: Given,Claim:- If there is convincing evidence that less than three-quarters (= 0.75) of adults…
Q: ALLUTED A student's course grade is based on one midterm that counts as 5% of his final grade, one…
A: The given data is,ScorePercentage (%)Midterm625Class project9425Homework assignment9535Final…
Q: Suppose the following table represents world oil production in millions of barrels a day for a…
A: The objective of the question is to calculate the percentage of oil production for each region and…
Q: 1. You investigated the effect of vitamin D on melanoma in males and females. After exposing the…
A: You are investigated the effect of vitamin D on melanoma in males and females. After exposing the…
Q: What is the probability of getting a negative triple-test result when the fetus actually has Down…
A: The events are denoted as follows:DS: The fetus actually has Down syndrome.no DS: The fetus actually…
Q: Use the same scales to construct boxplots for the pulse rates of men and women from the accompanying…
A: The data set for men's pulse rate is,…
Q: A common measure of toxicity for any pollutant is the concentration of the pollutant that will kill…
A: The question is about F distribution.Given :No. of sample values for copper ( n1 ) = 8No. of sample…
Q: A user is allowed to create an 8-digit password, but it must satisfy the following requirements: The…
A: The number of digits in the password is 8.The requirements of the password are: The first 2…
Q: You need to compute the a 90% confidence interval for the population mean. How large a sample should…
A: Given,Confidence level, C = 90% = 0.90Margin of error, E = 1.5Population standard deviation, σ = 9.2
Q: Real estate data were collected in San Luis Obispo County from August 2014. The following summarize…
A: The objective of the question is to identify the appropriate statistical test to determine if there…
Q: Glaucoma is an eye disease that is manifested by high intraocular pressure. The distribution of…
A: The mean (µ) is 15 mm Hg.The variance is 9 mm Hg.
Q: The accompanying data gives the results of a survey on the number of hours spent online per week on…
A: The sample size of females, The sample size of males, The data set is, Hours…
Q: Suppose that the distribution of diastolic blood pressure in men aged 35-44 years follows a normal…
A: For the distribution of the diastolic blood pressure, the parameters are given as follows:The mean,…
Q: Let (Xn)nzo be the following irreducible Markov chain: 1 A D (a) Deduce the period of each state.…
A: Given the transition diagram of , an irreducible Markov chain:
Q: Suppose 20% of the students in UCR commute to school every day. Among those who commute, 40% of them…
A: The objective of this question is to find the probability that a randomly selected student from UCR…
Q: Sexually Transmitted Disease Suppose a clinical trial is conducted to test the efficacy of a new…
A: The question is about confidence interval.Given :No. of patients who were given 4-g daily dose of…
Q: You need to compute the a 90% confidence interval for the population mean. How large a sample should…
A: σ=9.2E=1.5
Q: Given the following history, use a three-quarter moving average to forecast the demand for the third…
A: MonthLast YearThis…
Q: (c) It is desired to test Ho :p= 0.8 versus H₁ :p #0.8. Compute the test statistic z. Round the…
A: The information given in the original question is : Sample size , No.of individual in the category…
Q: a. Generate the 1000 revenues and retain the integer portion. b. Obtain a histogram for the data in…
A: We will generate 1000 revenues from an exponential distribution of parameter 1import numpy as np 2…
Q: TRY IT 2.18 Listed are 30 ages for Academy Award winning best actors in order from smallest to…
A: Here the given data values are : 18 ; 21 ; 22 ; 25 ; 26 ; 27 ; 29 ;30 ; 31 ; 31 ; 33 ; 36 ; 37 ; 41…
Q: Glaucoma is a disease of the eye that is manifested by high intraocular pressure. The distribution…
A: The mean (µ) is 15 mm Hg.The variance is 9 mm Hg.The standard deviation is square root of the…
Q: Thickness measurements of a coating process are made to the nearest hundredth of a millimeter. The…
A: Let X be the thickness measurement of a coating.Given that X follows a uniform distribution with…
Q: Based on a poll, among adults who regret getting tattoos, 13% say that they were too young when…
A: The objective of this question is to find the probability of certain outcomes when nine adults who…
Q: About 31% of a population are of a particular ethnic group. 130 people are randomly selected from…
A: p = 31% n = 130
Q: For the cumulative distribution function, find a. U b. P(x> 2) c. F(x= 6) d. P(x = 6) e. f(x = 4) f.…
A: we write the given Cumulative distribution function in the table formx147F(x)0.70.9U=1
Q: Exam scores on last year's Data Analysis final were normally distributed, with a mean (μ) of 67 and…
A: Last year's data analysis final exam scores have a normal distribution.Mean score, Standard…
Q: Consider the following hypotheses: Hg: με 191 HA: u < 191 A sample of 61 observations results in a…
A: Given the null and alternative hypothesis is ,Sample size , n = 61 Mean , 187 standard deviation ,…
Q: Because the mean is very sensitive to extreme values, it is not a resistant measure of center. By…
A: Here the given data values are : sample size , n = 20Using formula ,IQR = Q3 - Q1
Calculate the slope of the line of fit.

Step by step
Solved in 3 steps with 7 images

- Zipfs Law The following table shows U.S cities by rank in terms of population and population in thousands. City Rank r Population N New York 1 8491 Chicago 3 2722 Philadelphia 5 1560 Dallas 9 1280 Austin 11 913 San Francisco 13 852 Columbus 15 836 A rule known as Zipfs law tells us that it is reasonable to approximate these data with a power function. a Use power regression to express the population as a function of the rank. b Plot the data along with the power function from part a. c Phoenix is the sixth largest city in the United States. Use your answer from part a to estimate population of Phoenix. Round your answer in thousands to the nearest whole number. Note: The actual population is 1537 thousand.The prelim grades (x) and midterm grades (y) of a sample of 10 MMW students is modeled by the regression line y = 12.0623 + 0.7771x. Estimate the prelim grade if the midterm grade is 83.The table below list weights (carats) and prices (dollars) of randomly selected diamonds Weight 0.3 0.4 0.5 0.5 1.0 0.7 Price 510 1151 1343 1410 5669 2277 Find r Test with a .05 level of significance H0 : ρ = 0 and H1: : ρ ≠ 0 Find m and b for simple regression
- A sample of 10 people ingested a new formulation of a new drug. Six hours later, the concentrations in their bloodstreams, in nanograms per mililiter were as follows: 2.3 1.4 1.8 2.1 1.0 4.1 1.8 2.9 2.5 and 2.7. Construct a dot plot for this sample. Is it reasonable to treat the sample as coming from an approximately normal population? Explain.Find the residuals for the data. Graph a separate residual plot. Use Desmos and upload a screen shot below. Show Your WorkRegression analysis was applied between sales data (y) and advertising data (x) and the following information was obtained. SSR = 800SST = 1250Sample Size (n) = 12 The standard error of the estimate is
- Use the given data to find the equation of the regression line. Examine the scatterplot and identify a characteristic of the data that is ignored by the regression line.x y10 7.469 6.8311 13.1110 6.8111 7.5813 8.787 6.164 5.1612 7.846 6.656 5.52Find the Pearson r Correlation Coefficient: r = Blank 1 Find the equation of the regression line: y = Blank 2x + Blank 3 The purpose of calibration in this application is to estimate pressure from an observed scale reading. Estimate the pressure for a scale reading of 54: Pressure = Blank 4 lb/sq. inX Y 100 9.3 50 4.8 100 8.9 100 6.5 50 4.2 80 6.2 75 7.4 65 6 90 7.6 90 6.1 Use the appropriate formula to find the regression equation for the sample data. Use Regression equation
- Find the Pearson r Correlation Coefficient: r = Blank 1 Find the equation of the regression line: y = Blank 2x + Blank 3 Estimate the amount of particulate removed when the daily rainfall is x = 4.8 units: Blank 4 μg/m3The power of the slope t-test is NOT determined by: A)direction of slope B) sample size C) effect size D) alphaa. Show that the regression R2 in the regression of Y on X is the squaredvalue of the sample correlation between X and Y. That is, show thatR2 = r2XY.b. Show that the R2 from the regression of Y on X is the same as the R2from the regression of X on Y. c. Show that ^β1 = rXY (sY/sX), where rXY is the sample correlationbetween X and Y, and sX and sY are the sample standard deviationsof X and Y.


