A scatterplot was created from the collected data, with a linear regression model of y = 0.52r+ 3000. Use this equation to find the residual value of the circled point shown on the graph.
A scatterplot was created from the collected data, with a linear regression model of y = 0.52r+ 3000. Use this equation to find the residual value of the circled point shown on the graph.

Elementary Linear Algebra (MindTap Course List)
8th Edition
ISBN:9781305658004
Author:Ron Larson
Publisher:Ron Larson
Chapter2: Matrices
Section2.CR: Review Exercises
Problem 90CR

Related questions
Question
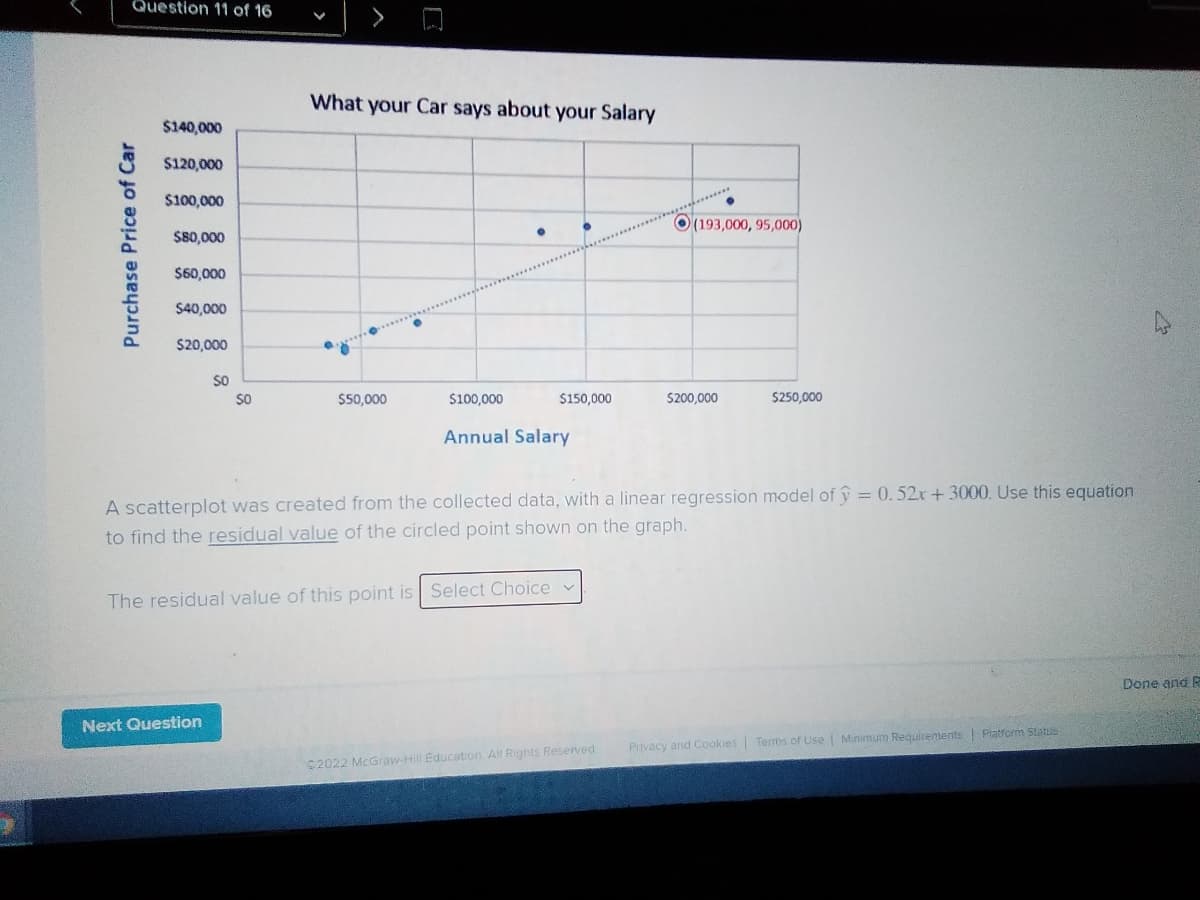
A study was conducted too see if a correlation exist between a person's annual salary and the car that they drive. ( please show me how to solve it because I have to show work on paper. Make it 8th level please)
Transcribed Image Text:Question 11 of 16
What your Car says about your Salary
$140,000
$120,000
$100,000
(193,000,95,000)
$80,000
$60,000
$40,000
$20,000
SO
SO
$50,000
$100,000
$150,000
S200,000
$250,000
Annual Salary
A scatterplot was created from the collected data, with a linear regression model of = 0.52r+3000. Use this equation
to find the residual value of the circled point shown on the graph.
The residual value of this point is Select Choice v
Done and R
Next Question
Pitvacy and Cookies Terms of Use Minimum Requirements Platform Status
C2022 McGraw-Hill Education All Rights Reserved
Purchase Price of Car
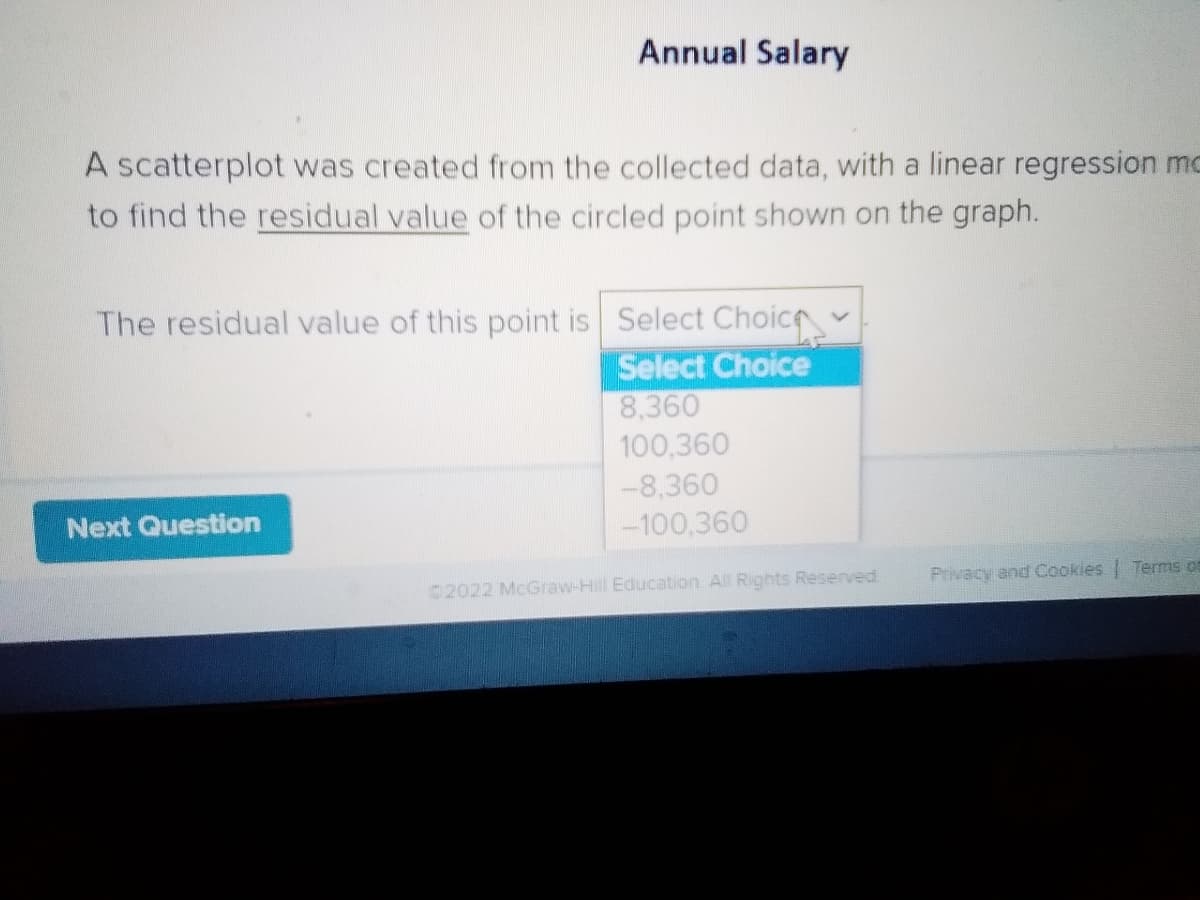
Transcribed Image Text:Annual Salary
A scatterplot was created from the collected data, with a linear regression mo
to find the residual value of the circled point shown on the graph.
The residual value of this point is Select Choice
Select Choice
8,360
100,360
-8,360
Next Question
-100,360
Privacy and Cookles Terms ot
2022 McGraw-Hill Education All Rights Reserved.
Expert Solution
This question has been solved!
Explore an expertly crafted, step-by-step solution for a thorough understanding of key concepts.

Step by step
Solved in 2 steps with 2 images

Recommended textbooks for you
Elementary Linear Algebra (MindTap Course List)
Algebra
ISBN:
9781305658004
Author:
Ron Larson
Publisher:
Cengage Learning

Functions and Change: A Modeling Approach to Coll…
Algebra
ISBN:
9781337111348
Author:
Bruce Crauder, Benny Evans, Alan Noell
Publisher:
Cengage Learning

College Algebra
Algebra
ISBN:
9781305115545
Author:
James Stewart, Lothar Redlin, Saleem Watson
Publisher:
Cengage Learning
Elementary Linear Algebra (MindTap Course List)
Algebra
ISBN:
9781305658004
Author:
Ron Larson
Publisher:
Cengage Learning
Functions and Change: A Modeling Approach to Coll…
Algebra
ISBN:
9781337111348
Author:
Bruce Crauder, Benny Evans, Alan Noell
Publisher:
Cengage Learning
College Algebra
Algebra
ISBN:
9781305115545
Author:
James Stewart, Lothar Redlin, Saleem Watson
Publisher:
Cengage Learning