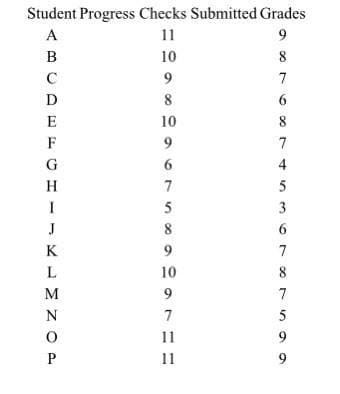
A certain Instructor believes that the grades of students is related to the number of progress checks they submitted to him. He would like to develop a linear regression equation to help him remind students to submit their activities on the allotted time.


Q: f(x, y) = = {x² +0<x< 1,0 <y < 2, 0,. elsewhere. g(x)= 2x (x + 1/3), h(y)= 1/3 + y/6. b. a.…
A:
Q: Assume that females have pulse rates that are normally distributed with a mean of μ=76.0 beats per…
A: From the provided information, Mean (µ) = 76.0 Standard deviation (σ) = 12.5 X~N (76.0, 12.5)
Q: i. j. Determine the correlation Determine the covariance of X and Y. of X and Y.
A:
Q: A student was asked to find a 90% confidence interval for widget width using data from a random…
A:
Q: Provide an appropriate response. Round the test statistic to the nearest thousandth. Compute the…
A: 8)Givenσ2=25.8sample size(n)=12sample variance(s2)=21.6α=0.05
Q: Jesse was ranked 36th in his graduating class of 180 students. At what percentile is Jesse's…
A:
Q: In 1945, an organization asked 1504 randomly sampled American citizens, "Do you think we can develop…
A: From the provided information, Sample size (n) = 1504 From which 792 responded yes. Level of…
Q: State the null and alternative hypotheses for a hypothesis test; indicate whether the hypothesis…
A: Explanation: Null hypothesis is a statement about a population parameter, such as the population…
Q: A Survey among Seniors revealed that the number of hours spent Studying the week before final exams…
A: Give Standard deviations=7 Mean=25 P(x>40)=?
Q: Develop
A: A) Pearson Correlation Coefficient:
Q: A study measures the dimensions of adult penguin bills for three species (Adelie, Gentoo and…
A: 1. Null and alternative hypotheses: The hypothesis, which is pre assumed as true, tentatively…
Q: The Office of Student Services at a large western state university maintains information on the…
A: Given problem is normal distribution Let X: time of undergraduate students study per week…
Q: e. Determine the expected value of X². f. Determine the expected value of Y². g. Determine the…
A:
Q: A binomial experiment has the given number of trials and the given success probability p. n=8, p=0.7…
A:
Q: 1. (a) With the aid of examples, discuss any three reasons why scholars like you undertake…
A: Given: The data is given. Sample size (n)=12
Q: Question 6 The new study also carried out a test to determine whether the population proportion of…
A: Hi there! Thanks for posting the question. Since there are multiple questions, please repost the…
Q: If P(B)=0.55,P(A | B)=0.90, P(B′)=0.45, and P(A | B′)=0.40, find P(B | A).
A:
Q: Give the F-statistic and p-value.
A: It is given that Mean sum of square of error is MSE = 154.9
Q: Determine the critical value Za/2 that corresponds to the given level of confidence. 86% 1.08 O 0.81…
A: As per our guidelines we can solve first multiple-choice question and rest can be reposted.…
Q: In 1945, an organization asked 1504 randomly sampled American citizens, "Do you think we can develop…
A: Given : population proportion = 0.5
Q: Q4/ The average on a statistics test was 78 with a standard deviation of 8. If the test scores are…
A: Given problem is normal distribution Let X: Test score Mean=μ=78 Standard deviation=σ=8 X~N(μ=78,…
Q: Estimate the average height(m) of MPA/MIRD 802 students from the infinite sample below. How…
A: The sample of heights of MPA/MIRD 802 students is as follows: 1.98, 2.03, 2.08, 2.16 and 1.85
Q: Q4/ The average on a statistics test was 78 with a standard deviation of 8. If the test scores are…
A:
Q: Given that a Condo is purchased, what is the probability the mortgage is Adjustable?
A: The given summarized table is, From the table, The probability of condo is purchased is,
Q: A travel association reported the domestic airfare (in dollars) for business travel for the current…
A:
Q: At an assembly plant for 4WD car, routine monitoring of the quality of welds yields the following…
A:
Q: What is the pooled standard deviation? What degrees of freedom are used in doing inferences for…
A: Given ANOVA table: Source DF SS MS F P Groups 3 973.93 324.64 6.43 0.003 Error 20 1010.34…
Q: The ages (in years) of a random sample of shoppers at a gaming store are shown. Determine the range,…
A:
Q: Q4/ The average on a statistics test was 78 with a standard deviation of 8. If the test scores are…
A: Mean(μ)=78 Standard deviation (σ)=8 The objective is to find the probability that a student gets a…
Q: ative signs, and 29 ties when the value of the second variable is subtracted from the corresponding…
A:
Q: 6. A questionnaire asks shareholders of a company to state whether they consider the chairman’s…
A: Given the probabilities of answers from randomly selected shareholders are as follows:Too High…
Q: residential area, is concerned with its service during the noon-to-1 pm lunch hour. The waiting…
A:
Q: √x² = 3, or² = 5, oxy = 2, Z = 2Y – 4X – 2 a. Determine the variance of Z.
A:
Q: The accompanying scatterplot shows the relationship between the age of an internet user and the…
A: Solution Given We are concerned about the normality of the error terms, we create a normal…
Q: The data to the right contain the state cigarette tax (in $) for all 20 regions of a country. 1.36…
A: Given that The state cigarette tax (in $) for all 20 regions of a country. 1.36 ,1.70 , 2.51 , 0.45…
Q: a commuter travels many miles to work each morning she has timed this trip 5 times during the last…
A:
Q: O a Sun Jun 19 10:03 PM ●●● M Inbox (2) - cjohnson@rcs137. X + Chrome File Edit View History…
A:
Q: A researcher wishes to estimate, with 95% confidence, the population proportion of adults who eat…
A: The objective is to estimate the sample size for the different estimated values of the sample…
Q: For a standard normal distribution, find: P(0.64 < z < 2.31)
A:
Q: Mr. A, an owner of a particular softdrink brand claims that the average capacity of their product is…
A:
Q: PROBLEM SET. Table 2.2 shows the frequency distribution of the time(hours per week) rendered by…
A:
Q: 3/4 $1 1/4 1/4 82 11/3
A: The states in the Markov Chain are: s1 s2 s3 f(s1) = Af(s2) = Bf(s3) = C s1…
Q: Suppose that 53% of the population favors a particular candidate IP a Random sample of 55 voters is…
A: The following information has been given: The sample size is n=55. The probability of success is…
Q: Q4/ The average on a statistics test was 78 with a standard deviation of 8. If the test scores are…
A: It is given that: μaverage score=78σstandard deviation of scores=8
Q: Z-Test Z-Test Use the calculator displays to the right to make a decision to reject or fail to…
A: Solution:- from given information Null hypothesis H0:μ=70Alternate hypothesis Ha:μ≠70(Two-tailed…
Q: If the Pearson correlation is measured between two variables X and Y and was - 0.56. This indicates…
A: The Pearson correlation measure the strength between two variables. The Pearson correlation is -0.56…
Q: 2. Hypothesis Tests - sigma unknown: AOL Time Warner Inc.'s CNN has been the longtime ratings leader…
A: We have Given that, sample size(n) =40 sample mean(x̄) = 612000 standard…
Q: normal distribution has a mean of 17 and a standard deviation of 5. Use the 68-95-99.7 rule to find…
A: mean = 17 and standard deviation = 5 Normal distribution Use empirical rule P(17<x<27) =?
Q: Determine the value of C P(1.06 ≤ Z ≤. C) = 0.1299
A: It is given that the probability value is 0.1299.
Q: Find how many coupon codes
A: HERE GIVEN, A supermarket wants to send codes for $0.25 off a bag of chips to its rewards program…
A certain Instructor believes that the grades of students is related to the number of progress checks they submitted to him. He would like to develop a linear regression equation to help him remind students to submit their activities on the allotted time.

Step by step
Solved in 2 steps with 4 images

- Assume that the probability that an airplane engine will fail during a torture test is 12and that the aircraft in question has 4 engines. Construct a sample space for the torture test. Use S for survive and F for fail.A pharmaceutical company wants to know whether an experimental drug has an effect on systolic blood pressure. Fifteen randomly selected subjects were given the drug and, after sufficient time for the drug to have an impact, their systolic blood pressures were recorded. The data appear below: 172140123130115 148108129137161 123152133128142172140123130115 148108129137161 123152133128142 Calculate the values of y¯¯¯y¯ and s for the 15 blood pressure readings.A student majoring in Management who has passed the Business Statistics course suspects that the average price of lunch at the canteen has increased during the pandemic. Before the pandemic, the price for lunch he paid was $21, $22, $22.50, $23, $23.50. After the pandemic, he paid $25, $25.50, $30, $27, and $26.50. a) Perform a hypothesis test analysis to find out whether there has been an average increase in the price of lunch (Use six Hypothesis Testing Steps) ! b) Interpret (and explain) the results of point a above!
- Nationally, the proportion of red cars on the road is 0.12. A statistically-minded fan of the Philadelphia Phillies (whose team color is red) wonders if fans who park at Citizens Bank Park (the Phillies home field) are more likely to drive red cars. One day during a home game, he takes an SRS of 210 cars parked in the lot while a game is being played, and counts 35 red cars. (There are 21,000 parking spaces.) Is this convincing evidence that Phillies fans prefer red cars more than the general population? Provide statistical evidence to support your conclusion. Use the 4-step process.In a study of high school students at least 16 years of age, researches obtained data summarized in the table below. Test the claim that texting while driving is independent of drinking alchohol and driving. Assume a significance level of 0.05. Drove when Drinking Did not drive when Drinking Totals Texting while Driving 731 3054 3785 No Texting and Driving 156 4564 4720 Totals 887 7618 8505 c) What is the Alternative Hypothesis? d) Which type of test will be used? e) What critical values are there?A clinical psychologist is interested in comparing the effectiveness of short term relaxation and cognitive-behavioral therapy in treating mild depression. An experiment is conducted in which 15 patients with mild depression are randomly selected and assigned 5 each to a relaxation therapy group, a cognitive/behavioral therapy group, and an attention placebo group. Therapy is administered until the patient is judged no longer depressed or until 10 treatment sessions have elapsed. The following data is obtained. Scores are the number of sessions for each patient. Cognitive/Behavioral Therapy Relaxation Therapy Attention-PlaceboGroup 56647 68 797 5 8 9 7 6 Using a = 0.05, Fcrit = _________.
- The contingency table shows a random sample of urban, suburban, and rural libraries and the speed of their Internet access. In the table, mbps represents megabits per second. At α = 0.01 can you conclude that the metropolitan status of libraries and Internet access speed are related? Metropolitan status Access speed Urban Suburban Rural 1.4 mbps or less 5 20 58 1.5 mbps – 3.0 mbps 24 46 65 Greater than 3.0 mbps 37 59 64 What is the Chi-square test statistics and the decision for this question. The Test statistics is . Leave your answer in 3 decimal places. DECISION: We the null hypothesis.At Community Hospital, the burn center is experimenting with a new plasma compress treatment. A random sample of n1 = 318 patients with minor burns received the plasma compress treatment. Of these patients, it was found that 266 had no visible scars after treatment. Another random sample of n2 = 418 patients with minor burns received no plasma compress treatment. For this group, it was found that 105 had no visible scars after treatment. Let p1 be the population proportion of all patients with minor burns receiving the plasma compress treatment who have no visible scars. Let p2 be the population proportion of all patients with minor burns not receiving the plasma compress treatment who have no visible scars. (a) Find a 90% confidence interval for p1 − p2.At Community Hospital, the burn center is experimenting with a new plasma compress treatment. A random sample of n1 = 334 patients with minor burns received the plasma compress treatment. Of these patients, it was found that 266 had no visible scars after treatment. Another random sample of n2 = 418 patients with minor burns received no plasma compress treatment. For this group, it was found that 105 had no visible scars after treatment. Let p1 be the population proportion of all patients with minor burns receiving the plasma compress treatment who have no visible scars. Let p2 be the population proportion of all patients with minor burns not receiving the plasma compress treatment who have no visible scars. (a) Find a 90% confidence interval for p1 − p2. (Round your answers to three decimal places.) lower limit upper limit
- An athletic trainer wants to see if a new treatment procedure for ankle sprains results in less ankle swelling than standard treatment 24 hours following the injury. Over several months, 30 athletes with ankle sprains are randomly assigned to receive either the standard care or new treatment procedure. Ankle swelling is measured using water displacement in both groups. Which t-test should be used to determine if one procedure resulted in more or less swelling than the other?Researchers at an epidemiology clinic are interested in the difference in the incidence of a number of severe adverse events that occur during a clinical trial between the control and treatment groups. Suppose the following table illustrates the incidences for the most common SAE reported in the population, severe nausea, reported over the course of the 10 year intervention. Total Participants Reporting Severe Nausea Total Participants Control 267 1789 Treatment 485 1024 A) Calculate the risk difference between the groups. B) Conduct a formal test to determine if there is a significant difference in the reports of severe nausea between the two groups. That is, What is your Z stat, p value, and interpret your results. Use an alpha level of 0.05.A CBS News poll conducted June 10 and 11, 2006, among a nationwide random sample of 651 adults, asked those adults about their party affiliation (Democrat, Republican or none) and their opinion of how the US economy was changing ("getting better," "getting worse" or "about the same"). The results are shown in the table below. bettersameworseRepublican3810444Democrat1287137none2190118 Express your answers as a decimal and round to four decimal places.If we randomly select one of the adults who participated in this study, compute: a. P(Democrat) = b. P(worse) = c. P(worse|Democrat) = d. P(Democrat|worse) = 3. P(Democrat and worse) =

