A statistical program is recommended. A large supermarket chain has invested heavily in data, technology, and analytics. Feeding predictive models with data from an infrared sensor system to anticipate when shoppers will reach the checkout counters, they are able to alert workers to open more checkout lines as needed. This has allowed them to lower their average checkout time from four minutes to less than 30 seconds. Consider the data in the following table containing 32 observations. Suppose each observation gives the arrival time (measured in minutes before 6 p.m.) and the shopping time (measured in minutes). (minutes before Shopping Time Arrival Time 6:00 p.m.) 58 (minutes) 23 Arrival Time (minutes before Shopping Time (minutes) 6:00 p.m.) 38 36 23 18 15 25 78 35 83 28 32 16 52 40 23 18 96 45 18 23 31 24 30 13 25 38 D 12 59 27 133 53 113 55 55 21 30 23 0 13 109 42 92 37 49 27 26 15 102 42 12 72 28 17 114 21 (a) Develop a scatter diagram for arrival time as the independent variable. 120 0 shopping Time (Minutes) 30 140 B 120- 60 20 60 80 100 120 140 Arrival Time (Minutes Before 6:00p.m.) 0 20 60 Shopping Time (Minutes) (b) What does the scatter diagram developed in part (a) indicate about the relationship between the two variables? The scatter diagram Indicates a nonlinear relationship between arrival time and shopping time. The scatter diagram indicates a negative linear relationship between arrival time and shopping time. The scatter diagram indicates a positive linear relationship between arrival time and shopping time. The scatter diagram indicates no apparent relationship between arrival time and shopping time. 30 60 100 120 140 Arrival Time (Minutes Before no pan.)
A statistical program is recommended. A large supermarket chain has invested heavily in data, technology, and analytics. Feeding predictive models with data from an infrared sensor system to anticipate when shoppers will reach the checkout counters, they are able to alert workers to open more checkout lines as needed. This has allowed them to lower their average checkout time from four minutes to less than 30 seconds. Consider the data in the following table containing 32 observations. Suppose each observation gives the arrival time (measured in minutes before 6 p.m.) and the shopping time (measured in minutes). (minutes before Shopping Time Arrival Time 6:00 p.m.) 58 (minutes) 23 Arrival Time (minutes before Shopping Time (minutes) 6:00 p.m.) 38 36 23 18 15 25 78 35 83 28 32 16 52 40 23 18 96 45 18 23 31 24 30 13 25 38 D 12 59 27 133 53 113 55 55 21 30 23 0 13 109 42 92 37 49 27 26 15 102 42 12 72 28 17 114 21 (a) Develop a scatter diagram for arrival time as the independent variable. 120 0 shopping Time (Minutes) 30 140 B 120- 60 20 60 80 100 120 140 Arrival Time (Minutes Before 6:00p.m.) 0 20 60 Shopping Time (Minutes) (b) What does the scatter diagram developed in part (a) indicate about the relationship between the two variables? The scatter diagram Indicates a nonlinear relationship between arrival time and shopping time. The scatter diagram indicates a negative linear relationship between arrival time and shopping time. The scatter diagram indicates a positive linear relationship between arrival time and shopping time. The scatter diagram indicates no apparent relationship between arrival time and shopping time. 30 60 100 120 140 Arrival Time (Minutes Before no pan.)

Functions and Change: A Modeling Approach to College Algebra (MindTap Course List)
6th Edition
ISBN:9781337111348
Author:Bruce Crauder, Benny Evans, Alan Noell
Publisher:Bruce Crauder, Benny Evans, Alan Noell
Chapter5: A Survey Of Other Common Functions
Section5.3: Modeling Data With Power Functions
Problem 6E: Urban Travel Times Population of cities and driving times are related, as shown in the accompanying...
Question
Excel please show using excel and written steps also. Thanks
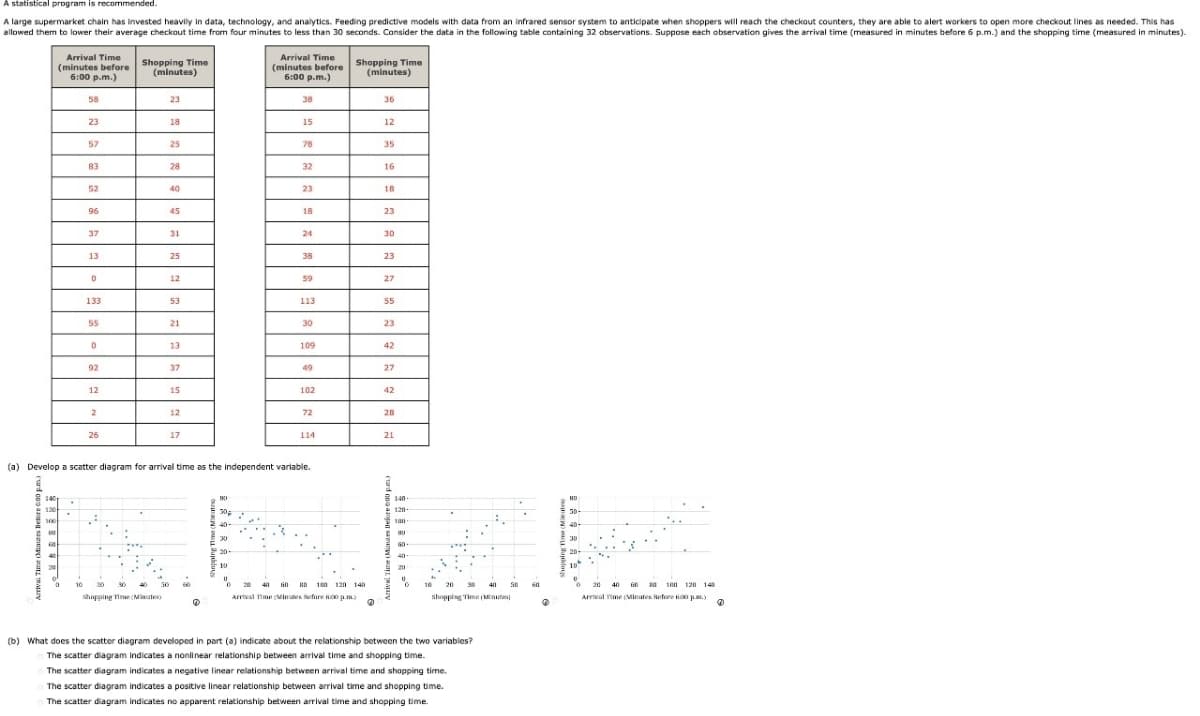
Transcribed Image Text:A statistical program is recommended.
A large supermarket chain has invested heavily in data, technology, and analytics. Feeding predictive models with data from an infrared sensor system to anticipate when shoppers will reach the checkout counters, they are able to alert workers to open more checkout lines as needed. This has
allowed them to lower their average checkout time from four minutes to less than 30 seconds. Consider the data in the following table containing 32 observations. Suppose each observation gives the arrival time (measured in minutes before 6 p.m.) and the shopping time (measured in minutes).
(minutes before Shopping Time
Arrival Time
6:00 p.m.)
58
(minutes)
23
Arrival Time
(minutes before Shopping Time
(minutes)
6:00 p.m.)
38
36
23
18
15
25
78
35
83
28
32
16
52
40
23
18
96
45
18
23
31
24
30
13
25
38
D
12
59
27
133
53
113
55
55
21
30
23
0
13
109
42
92
37
49
27
26
15
102
42
12
72
28
17
114
21
(a) Develop a scatter diagram for arrival time as the independent variable.
120
0
shopping Time (Minutes)
30
140
B
120-
60
20
60 80 100 120 140
Arrival Time (Minutes Before 6:00p.m.)
0
20
60
Shopping Time (Minutes)
(b) What does the scatter diagram developed in part (a) indicate about the relationship between the two variables?
The scatter diagram Indicates a nonlinear relationship between arrival time and shopping time.
The scatter diagram indicates a negative linear relationship between arrival time and shopping time.
The scatter diagram indicates a positive linear relationship between arrival time and shopping time.
The scatter diagram indicates no apparent relationship between arrival time and shopping time.
30
60
100 120 140
Arrival Time (Minutes Before no pan.)
Expert Solution
This question has been solved!
Explore an expertly crafted, step-by-step solution for a thorough understanding of key concepts.

Step by step
Solved in 2 steps with 7 images

Recommended textbooks for you
Functions and Change: A Modeling Approach to Coll…
Algebra
ISBN:
9781337111348
Author:
Bruce Crauder, Benny Evans, Alan Noell
Publisher:
Cengage Learning

Glencoe Algebra 1, Student Edition, 9780079039897…
Algebra
ISBN:
9780079039897
Author:
Carter
Publisher:
McGraw Hill

Big Ideas Math A Bridge To Success Algebra 1: Stu…
Algebra
ISBN:
9781680331141
Author:
HOUGHTON MIFFLIN HARCOURT
Publisher:
Houghton Mifflin Harcourt
Functions and Change: A Modeling Approach to Coll…
Algebra
ISBN:
9781337111348
Author:
Bruce Crauder, Benny Evans, Alan Noell
Publisher:
Cengage Learning
Glencoe Algebra 1, Student Edition, 9780079039897…
Algebra
ISBN:
9780079039897
Author:
Carter
Publisher:
McGraw Hill
Big Ideas Math A Bridge To Success Algebra 1: Stu…
Algebra
ISBN:
9781680331141
Author:
HOUGHTON MIFFLIN HARCOURT
Publisher:
Houghton Mifflin Harcourt