A statistical program is recommended. An article gave the data, shown in the table below, on dimensions of 27 representative food products. Product 1 2 3 4 5 6 7 8 10 11 12 13 14 15 16 17 18 19 20 21 22 23 24 25 26 27 Material Height glass glass glass glass plastic glass glass plastic plastic plastic tin plastic glass glass glass glass cardboard glass glass glass glass glass glass plastic tin tin 7.7 6.2 8.5 10.4 8.0 O Ho: B₁-B₂-B₂ = 0 8.7 10.2 O Ho: B₁-B₂-B₂-0 10.5 3.4 6.9 10.9 cardboard 17.1 9.7 10.1 13.0 13.0 11.0 8.7 16.5 16.5 9.7 17.8 14.0 13.6 27.9 19.5 13.8 O we should consider the adjusted O We should consider the adjusted O We should consider the adjusted Maximum Width O Ho: at least one of B₁, B₂ or B₂ is not 0 H₂: B₁-B₂-B₂=0 2.50 2.90 2.15 H: B₂B and B, are all not 0 2.90 3.20 2.00 1.60 4.80 5.90 5.80 2.90 2.45 2.60 2.60 2,70 3.10 5.10 10.20 3.50 2.70 3.00 2.70 2.50 2.40 4.40 7.50 4.25 (c) Carry out a model utility F test at a 0.05 significance level. State the null and alternative hypotheses. O Ho: B₁ B₂ and ₂ are all not 0 H₂: B₁-B₂ =B₂ = 0 H: at least one of B₁ B₂ or ₂ is not 0 Minimum Width 1.80 2.70 2.00 2.60 3.15 1.80 1.50 3.80 5.00 4.75 2.80 2.10 2.20 2.60 2.60 2.90 5.10 10.20 3.50 1.20 1.70 1.75 1.70 1.20 1.20 7.50 4.25 Elongation Volume 1.50 1.07 Calculate the test statistic. (Round your answer to two decimal places.) F = 1.98 1.79 1.25 2.17 3.19 1.09 0.29 0.59 1.88 1.98 1.94 2.50 2.41 1.77 0.85 0.84 2.36 3.06 1.62 3.30 2.80 2.83 3.17 1.30 1.62 129 137 Use technology to calculate the P-value. (Round your answer to four decimal places.) P-value= 179 289 334 85 120 518 334 573 335 180 235 235 357 314 636 1254 648 (a) Fit a multiple regression model for predicting the volume (in ml) of a package based on its minimum width, maximum width, and elongation score. (Round your numerical values to two decimal places. Use x, for minimum width, x₂ for the r 302 (b) Why should we consider adjusted R² instead of R2 when evaluating this model? O We should consider the adjusted instead of 2 because it takes into account the number of predictors used in the model. In this case the adjusted is noticeably less than ². ² instead of r² because it does not take into account the number of predictors used in the model. In this case the adjusted ² is noticeably greater than ². instead of because it does not take into account the number of predictors used in the model. In this case the adjusted is noticeably less than 2. instead of 2 because it takes into account the number of predictors used in the model. In this case the adjusted is noticeably greater than 2. 320 301 250 195 1201 2325 728 What can you conclude? O Reject H. We have convincing evidence that the multiple regression model is useful and can conclude that ₁, ₂ and 6 are all not 0. O Reject H. We have convincing evidence that the multiple regression model is useful and can conclude that at least one of ₁, ₂ or 3 is not 0. O Fail to reject H. We do not have convincing evidence that the multiple regression model is useful and cannot conclude that ₁, ₂ and ₂ are all not 0. O Fail to reject Ho- We do not have convincing evidence that the multiple regression model is useful and cannot conclude that at least one of B₁, B₂ or B₂ is not 0.
A statistical program is recommended. An article gave the data, shown in the table below, on dimensions of 27 representative food products. Product 1 2 3 4 5 6 7 8 10 11 12 13 14 15 16 17 18 19 20 21 22 23 24 25 26 27 Material Height glass glass glass glass plastic glass glass plastic plastic plastic tin plastic glass glass glass glass cardboard glass glass glass glass glass glass plastic tin tin 7.7 6.2 8.5 10.4 8.0 O Ho: B₁-B₂-B₂ = 0 8.7 10.2 O Ho: B₁-B₂-B₂-0 10.5 3.4 6.9 10.9 cardboard 17.1 9.7 10.1 13.0 13.0 11.0 8.7 16.5 16.5 9.7 17.8 14.0 13.6 27.9 19.5 13.8 O we should consider the adjusted O We should consider the adjusted O We should consider the adjusted Maximum Width O Ho: at least one of B₁, B₂ or B₂ is not 0 H₂: B₁-B₂-B₂=0 2.50 2.90 2.15 H: B₂B and B, are all not 0 2.90 3.20 2.00 1.60 4.80 5.90 5.80 2.90 2.45 2.60 2.60 2,70 3.10 5.10 10.20 3.50 2.70 3.00 2.70 2.50 2.40 4.40 7.50 4.25 (c) Carry out a model utility F test at a 0.05 significance level. State the null and alternative hypotheses. O Ho: B₁ B₂ and ₂ are all not 0 H₂: B₁-B₂ =B₂ = 0 H: at least one of B₁ B₂ or ₂ is not 0 Minimum Width 1.80 2.70 2.00 2.60 3.15 1.80 1.50 3.80 5.00 4.75 2.80 2.10 2.20 2.60 2.60 2.90 5.10 10.20 3.50 1.20 1.70 1.75 1.70 1.20 1.20 7.50 4.25 Elongation Volume 1.50 1.07 Calculate the test statistic. (Round your answer to two decimal places.) F = 1.98 1.79 1.25 2.17 3.19 1.09 0.29 0.59 1.88 1.98 1.94 2.50 2.41 1.77 0.85 0.84 2.36 3.06 1.62 3.30 2.80 2.83 3.17 1.30 1.62 129 137 Use technology to calculate the P-value. (Round your answer to four decimal places.) P-value= 179 289 334 85 120 518 334 573 335 180 235 235 357 314 636 1254 648 (a) Fit a multiple regression model for predicting the volume (in ml) of a package based on its minimum width, maximum width, and elongation score. (Round your numerical values to two decimal places. Use x, for minimum width, x₂ for the r 302 (b) Why should we consider adjusted R² instead of R2 when evaluating this model? O We should consider the adjusted instead of 2 because it takes into account the number of predictors used in the model. In this case the adjusted is noticeably less than ². ² instead of r² because it does not take into account the number of predictors used in the model. In this case the adjusted ² is noticeably greater than ². instead of because it does not take into account the number of predictors used in the model. In this case the adjusted is noticeably less than 2. instead of 2 because it takes into account the number of predictors used in the model. In this case the adjusted is noticeably greater than 2. 320 301 250 195 1201 2325 728 What can you conclude? O Reject H. We have convincing evidence that the multiple regression model is useful and can conclude that ₁, ₂ and 6 are all not 0. O Reject H. We have convincing evidence that the multiple regression model is useful and can conclude that at least one of ₁, ₂ or 3 is not 0. O Fail to reject H. We do not have convincing evidence that the multiple regression model is useful and cannot conclude that ₁, ₂ and ₂ are all not 0. O Fail to reject Ho- We do not have convincing evidence that the multiple regression model is useful and cannot conclude that at least one of B₁, B₂ or B₂ is not 0.

Big Ideas Math A Bridge To Success Algebra 1: Student Edition 2015
1st Edition
ISBN:9781680331141
Author:HOUGHTON MIFFLIN HARCOURT
Publisher:HOUGHTON MIFFLIN HARCOURT
Chapter11: Data Analysis And Displays
Section11.2: Box-and-whisker Plots
Problem 6E

Related questions
Question
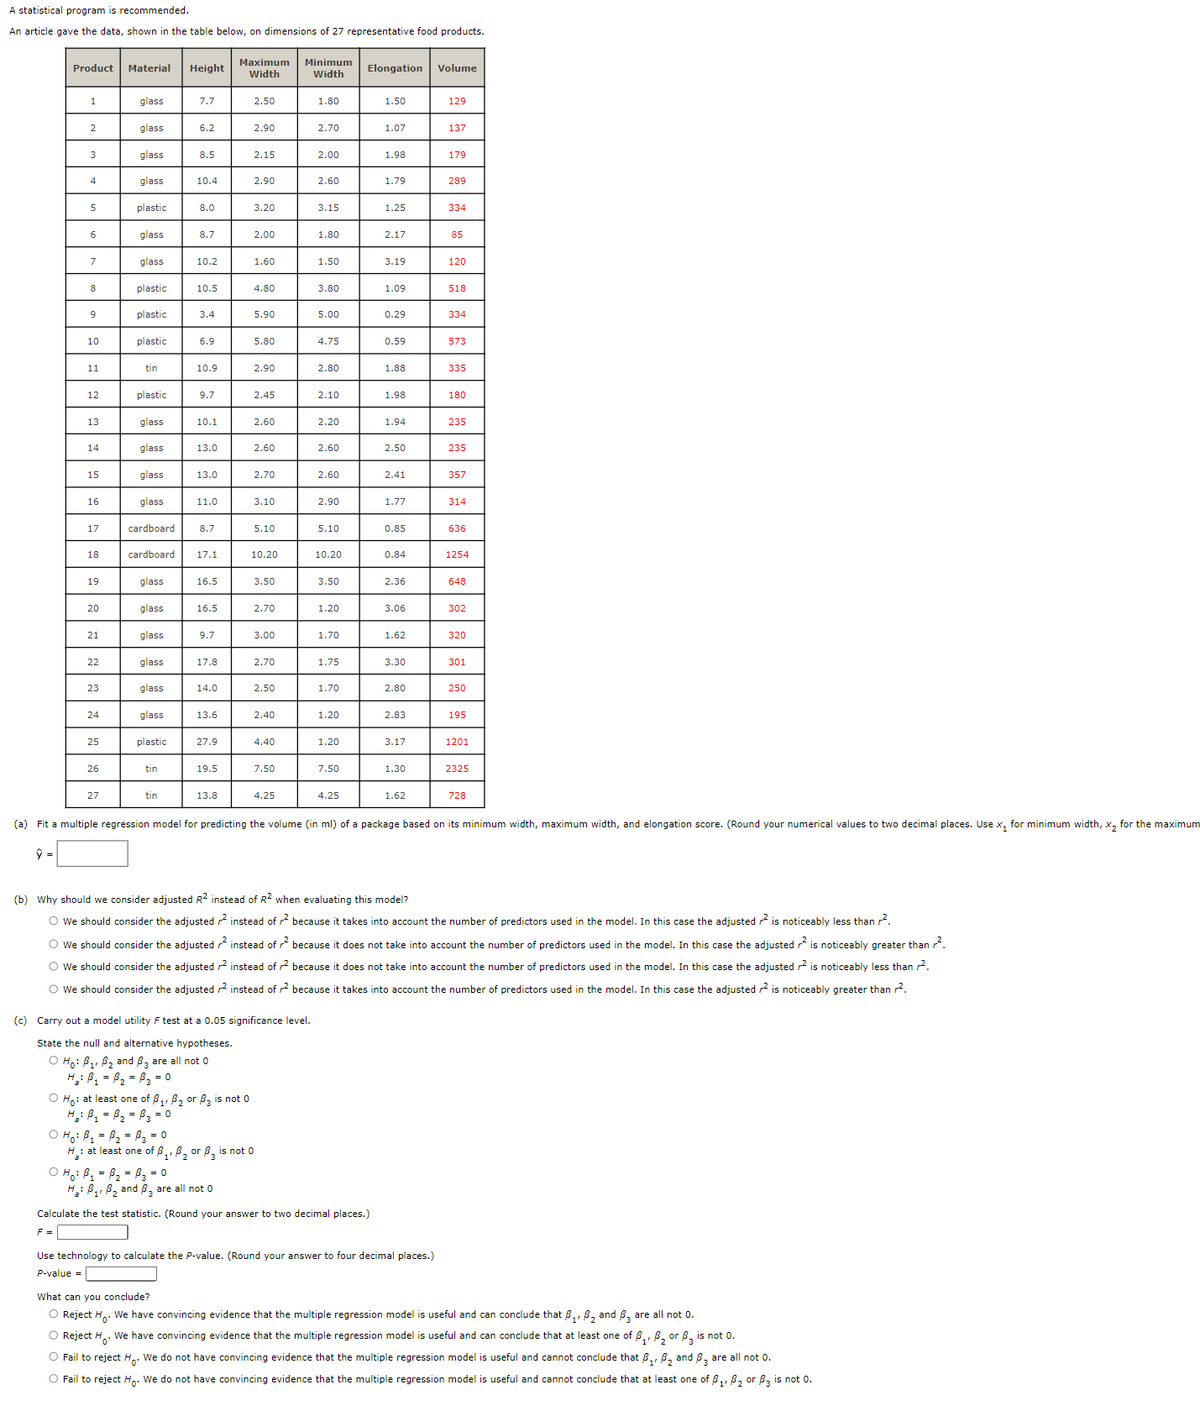
Transcribed Image Text:A statistical program is recommended.
An article gave the data, shown in the table below, on dimensions of 27 representative food products.
Product
1
3
4
5
6
7
8
9
10
11
12
13
14
15
16
17
18
19
20
21
22
23
24
25
26
27
Material Height
glass
glass
glass
glass
plastic
glass
glass
plastic
plastic
plastic
tin
plastic
glass
glass
glass
glass
cardboard
cardboard
glass
glass
glass
glass
glass
glass
plastic
tin
tin
7.7
6.2
8.5
10.4
8.0
O Ho: B₁ = B₂= B3 = 0
8.7
10.2
10.5
3.4
6.9
10.9
9.7
10.1
13.0
13.0
11.0
8.7
17.1
16.5
16.5
9.7
17.8
14.0
13.6
27.9
19.5
13.8
Maximum
Width
2.50
2.90
O Ho: at least one of B₁, B₂ or 3 is not 0
H₁₂ : B₁ = B₂= B₂ = 0
2.15
2.90
3.20
2.00
1.60
4.80
5.90
5.80
2.90
2.45
2.60
2.60
2.70
3.10
5.10
10.20
3.50
2.70
3.00
2.70
2.50
2.40
4.40
7.50
4.25
OH₁ B₁ B₂ = B₂ = 0
H₂: at least one of B₁, B₂ or B₂ is not 0
Minimum
Width
(c) Carry out a model utility F test at a 0.05 significance level.
State the null and alternative hypotheses.
O Ho: B₁, B₂ and 3 are all not 0
H₂: B₁ = B₂ = B₂ = 0
1.80
2.70
2.00
2.60
3.15
1.80
1.50
3.80
5.00
4.75
2.80
2.10
2.20
2.60
2.60
2.90
5.10
10.20
3.50
1.20
1.70
1.75
1.70
1.20
1.20
7.50
4.25
Elongation
1.50
1.07
H₂ B₁ B₂ and ₂ are all not 0
Calculate the test statistic. (Round your answer to two decimal places.)
F =
1.98
1.79
1.25
2.17
3.19
1.09
0.29
0.59
1.88
1.98
1.94
2.50
2.41
1.77
0.85
0.84
2.36
3.06
1.62
3.30
2.80
2.83
3.17
1.30
1.62
Volume
129
Use technology to calculate the P-value. (Round your answer to four decimal places.)
P-value =
137
179
289
334
85
120
518
334
573
335
180
235
235
357
314
636
1254
648
302
320
301
(a) Fit a multiple regression model for predicting the volume (in ml) of a package based on its minimum width, maximum width, and elongation score. (Round your numerical values to two decimal places. Use x, for minimum width, x₂ for the maximum
250
(b) Why should we consider adjusted R2 instead of R2 when evaluating this model?
O We should consider the adjusted ² instead of r² because it takes into account the number of predictors used in the model. In this case the adjusted ² is noticeably less than ².
O We should consider the adjusted ² instead of r² because does not take into account the number of predictors used in the model. In this case the adjusted ² is noticeably greater than ².
O We should consider the adjusted ² instead of r² because it does not take into account the number of predictors used in the model. In this case the adjusted r² is noticeably less than 2.
O We should consider the adjusted 2 instead of r² because it takes into account the number of predictors used in the model. In this case the adjusted r² is noticeably greater than ².
195
1201
2325
728
What can you conclude?
O Reject H. We have convincing evidence that the multiple regression model is useful and can conclude that B₁, B₂ and 3 are all not 0.
O Reject H. We have convincing evidence that the multiple regression model is useful and can conclude that at least one of B₁, B₂ or $3 is not 0.
O Fail to reject H. We do not have convincing evidence that the multiple regression model is useful and cannot conclude that B₁, B₂ and 3 are all not 0.
O Fail to reject Ho. We do not have convincing evidence that the multiple regression model is useful and cannot conclude that at least one of B₁, B₂ or 33 is not 0.
Expert Solution
This question has been solved!
Explore an expertly crafted, step-by-step solution for a thorough understanding of key concepts.

Step by step
Solved in 3 steps with 1 images

Recommended textbooks for you
Big Ideas Math A Bridge To Success Algebra 1: Stu…
Algebra
ISBN:
9781680331141
Author:
HOUGHTON MIFFLIN HARCOURT
Publisher:
Houghton Mifflin Harcourt

Algebra & Trigonometry with Analytic Geometry
Algebra
ISBN:
9781133382119
Author:
Swokowski
Publisher:
Cengage
Big Ideas Math A Bridge To Success Algebra 1: Stu…
Algebra
ISBN:
9781680331141
Author:
HOUGHTON MIFFLIN HARCOURT
Publisher:
Houghton Mifflin Harcourt
Algebra & Trigonometry with Analytic Geometry
Algebra
ISBN:
9781133382119
Author:
Swokowski
Publisher:
Cengage