A statistical program is recommended. Consider the following data for a dependent variable y and two independent variables, x₁ and x₂. X1 X₂ 30 12 94 47 51 40 25 17 112 51 74 36 59 10 76 y 108 16 178 19 5 94 12 175 7 170 117 13 142 16 211
A statistical program is recommended. Consider the following data for a dependent variable y and two independent variables, x₁ and x₂. X1 X₂ 30 12 94 47 51 40 25 17 112 51 74 36 59 10 76 y 108 16 178 19 5 94 12 175 7 170 117 13 142 16 211

College Algebra
7th Edition
ISBN:9781305115545
Author:James Stewart, Lothar Redlin, Saleem Watson
Publisher:James Stewart, Lothar Redlin, Saleem Watson
Chapter1: Equations And Graphs
Section: Chapter Questions
Problem 10T: Olympic Pole Vault The graph in Figure 7 indicates that in recent years the winning Olympic men’s...

Related questions
Question
Need help solving a b and c
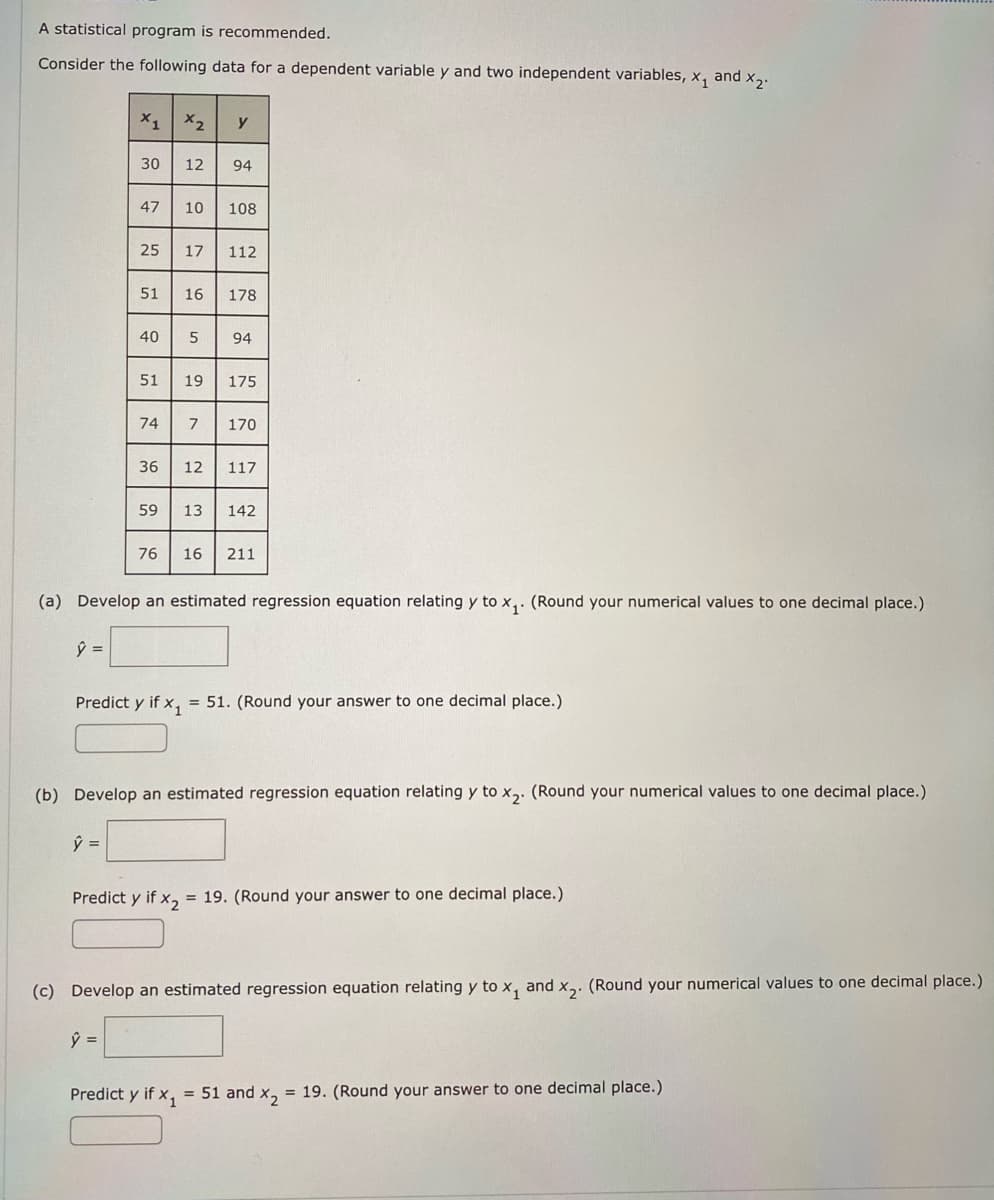
Transcribed Image Text:A statistical program is recommended.
Consider the following data for a dependent variable y and two independent variables, x₁ and x₂.
X1 X2
30 12 94
47
ŷ =
25 17 112
51 16 178
51
40 5 94
74
y
36
59
10 108
76
19 175
7 170
12 117
Predict y if X₁
13 142
(a) Develop an estimated regression equation relating y to x₁. (Round your numerical values to one decimal place.)
ŷ =
16 211
Predict y if x₁ = 51. (Round your answer to one decimal place.)
(b) Develop an estimated regression equation relating y to x₂. (Round your numerical values to one decimal place.)
Predict y if x₂ = 19. (Round your answer to one decimal place.)
(c) Develop an estimated regression equation relating y to x, and x₂. (Round your numerical values to one decimal place.)
ŷ =
= 51 and x₂ = 19. (Round your answer to one decimal place.)
Expert Solution
This question has been solved!
Explore an expertly crafted, step-by-step solution for a thorough understanding of key concepts.

Step by step
Solved in 5 steps with 46 images

Recommended textbooks for you
College Algebra
Algebra
ISBN:
9781305115545
Author:
James Stewart, Lothar Redlin, Saleem Watson
Publisher:
Cengage Learning

Functions and Change: A Modeling Approach to Coll…
Algebra
ISBN:
9781337111348
Author:
Bruce Crauder, Benny Evans, Alan Noell
Publisher:
Cengage Learning

Algebra and Trigonometry (MindTap Course List)
Algebra
ISBN:
9781305071742
Author:
James Stewart, Lothar Redlin, Saleem Watson
Publisher:
Cengage Learning
College Algebra
Algebra
ISBN:
9781305115545
Author:
James Stewart, Lothar Redlin, Saleem Watson
Publisher:
Cengage Learning
Functions and Change: A Modeling Approach to Coll…
Algebra
ISBN:
9781337111348
Author:
Bruce Crauder, Benny Evans, Alan Noell
Publisher:
Cengage Learning
Algebra and Trigonometry (MindTap Course List)
Algebra
ISBN:
9781305071742
Author:
James Stewart, Lothar Redlin, Saleem Watson
Publisher:
Cengage Learning