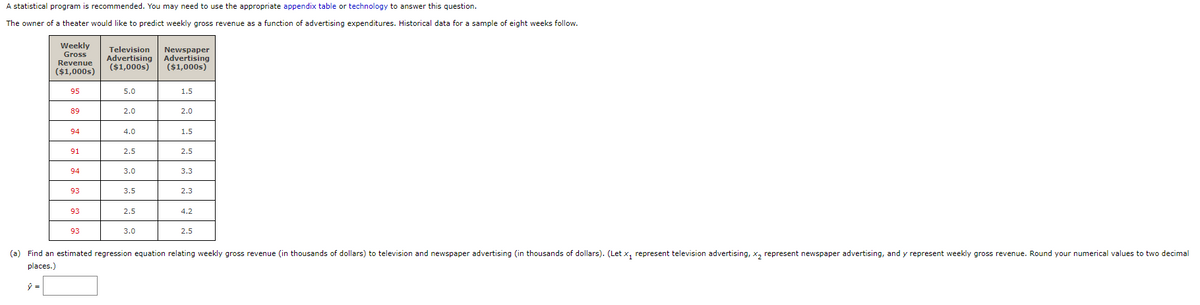
A statistical program is recommended. You may need to use the appropriate appendix table or technology to answer this question. The owner of a theater would like to predict weekly gross revenue as a function of advertising expenditures. Historical data for a sample of eight weeks follow. Newspaper Weekly Television Gross Advertising Advertising Revenue ($1,000s) ($1,000s) ($1,000s) 95 89 94 91 94 93 93 5.0 2.0 4.0 2.5 3.0 3.5 2.5 3.0 1.5 2.0 1.5 2.5 3.3 2.3 4.2 2.5 (a) Find an estimated regression equation relating weekly gross revenue (in thousands of dollars) to television and newspaper advertising (in thousands of dollars). (Let x, represent television advertising, x₂ represent newspaper advertising, and y represent weekly gross revenue. Round your numerical values to two decimal places.)
A statistical program is recommended. You may need to use the appropriate appendix table or technology to answer this question. The owner of a theater would like to predict weekly gross revenue as a function of advertising expenditures. Historical data for a sample of eight weeks follow. Newspaper Weekly Television Gross Advertising Advertising Revenue ($1,000s) ($1,000s) ($1,000s) 95 89 94 91 94 93 93 5.0 2.0 4.0 2.5 3.0 3.5 2.5 3.0 1.5 2.0 1.5 2.5 3.3 2.3 4.2 2.5 (a) Find an estimated regression equation relating weekly gross revenue (in thousands of dollars) to television and newspaper advertising (in thousands of dollars). (Let x, represent television advertising, x₂ represent newspaper advertising, and y represent weekly gross revenue. Round your numerical values to two decimal places.)

Linear Algebra: A Modern Introduction
4th Edition
ISBN:9781285463247
Author:David Poole
Publisher:David Poole
Chapter4: Eigenvalues And Eigenvectors
Section4.6: Applications And The Perron-frobenius Theorem
Problem 22EQ

Related questions
Question
100%
Transcribed Image Text:A statistical program is recommended. You may need to use the appropriate appendix table or technology to answer this question.
The owner of a theater would like to predict weekly gross revenue as a function of advertising expenditures. Historical data for a sample of eight weeks follow.
Weekly
Television
Newspaper
Gross Advertising Advertising
Revenue ($1,000s) ($1,000s)
($1,000s)
95
89
94
91
94
93
93
93
5.0
2.0
4.0
2.5
3.0
3.5
2.5
3.0
1.5
2.0
1.5
2.5
3.3
2.3
4.2
2.5
(a) Find an estimated regression equation relating weekly gross revenue (in thousands of dollars) to television and newspaper advertising (in thousands of dollars). (Let x₁ represent television advertising, x₂ represent newspaper advertising, and y represent weekly gross revenue. Round your numerical values to two decimal
places.)
ŷ =
Expert Solution
Step 1
Let represent television advertising.
represent newspaper advertising.
And represent weekly gross revenue.
We have given data,
| 95 | 5.0 | 1.5 |
| 89 | 2.0 | 2.0 |
| 94 | 4.0 | 1.5 |
| 91 | 2.5 | 2.5 |
| 94 | 3.0 | 3.3 |
| 93 | 3.5 | 2.3 |
| 93 | 2.5 | 4.2 |
| 93 | 3.0 | 2.5 |

Trending now
This is a popular solution!

Step by step
Solved in 3 steps

Recommended textbooks for you
Linear Algebra: A Modern Introduction
Algebra
ISBN:
9781285463247
Author:
David Poole
Publisher:
Cengage Learning

Big Ideas Math A Bridge To Success Algebra 1: Stu…
Algebra
ISBN:
9781680331141
Author:
HOUGHTON MIFFLIN HARCOURT
Publisher:
Houghton Mifflin Harcourt

Glencoe Algebra 1, Student Edition, 9780079039897…
Algebra
ISBN:
9780079039897
Author:
Carter
Publisher:
McGraw Hill
Linear Algebra: A Modern Introduction
Algebra
ISBN:
9781285463247
Author:
David Poole
Publisher:
Cengage Learning
Big Ideas Math A Bridge To Success Algebra 1: Stu…
Algebra
ISBN:
9781680331141
Author:
HOUGHTON MIFFLIN HARCOURT
Publisher:
Houghton Mifflin Harcourt
Glencoe Algebra 1, Student Edition, 9780079039897…
Algebra
ISBN:
9780079039897
Author:
Carter
Publisher:
McGraw Hill