A student in an animal physiology class did an experiment to determine the effect of environmental temperature on the heart rate of leopard frogs. She obtained 11 frogs of approximately the same age, size, and gender, and randomly assigned each animal to a container kept at a temperature between 3 and 33°C. After the frogs had equilibrated to the ambient temperature, she measured their basal heart rate (BHR). The output below displays the results of exploratory data analysis and linear regression analysis of the association between basal heart rate (RHR) and Temporoturo (T
A student in an animal physiology class did an experiment to determine the effect of environmental temperature on the heart rate of leopard frogs. She obtained 11 frogs of approximately the same age, size, and gender, and randomly assigned each animal to a container kept at a temperature between 3 and 33°C. After the frogs had equilibrated to the ambient temperature, she measured their basal heart rate (BHR). The output below displays the results of exploratory data analysis and linear regression analysis of the association between basal heart rate (RHR) and Temporoturo (T

Linear Algebra: A Modern Introduction
4th Edition
ISBN:9781285463247
Author:David Poole
Publisher:David Poole
Chapter4: Eigenvalues And Eigenvectors
Section4.6: Applications And The Perron-frobenius Theorem
Problem 25EQ

Related questions
Question
100%
Given the data provided, I need help solving parts C-E of my problem.
Thank you in advance!
Transcribed Image Text:Cause
effect
5.
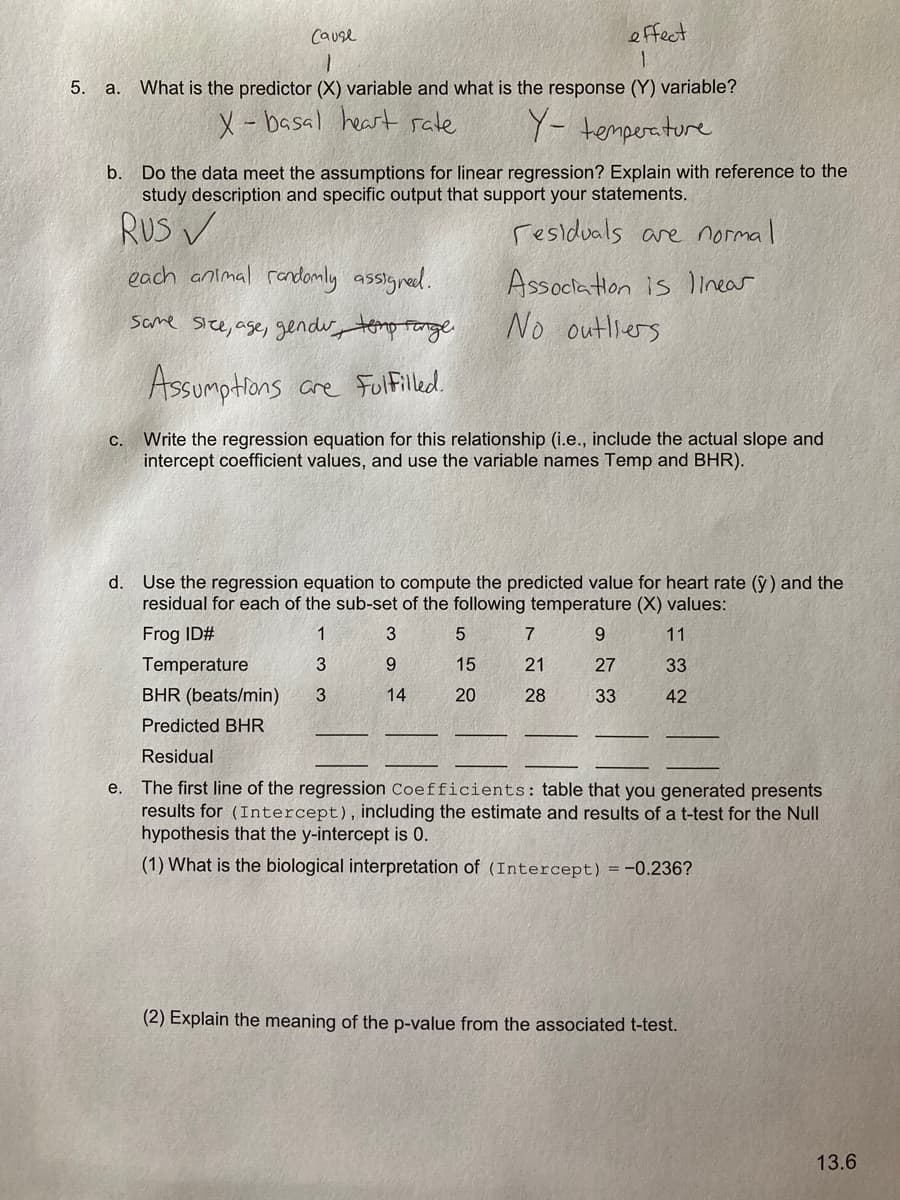
a. What is the predictor (X) variable and what is the response (Y) variable?
X-basal heart sate
Y- temperature
Do the data meet the assumptions for linear regression? Explain with reference to the
study description and specific output that support your statements.
b.
RUs v
residuals are normal
each animal randomly assigred.
Association is inear
No outliers
same size, age, gendry tomp targe
Assumptions are FuifFiled
Write the regression equation for this relationship (i.e., include the actual slope and
intercept coefficient values, and use the variable names Temp and BHR).
C.
d.
Use the regression equation to compute the predicted value for heart rate (ỳ) and the
residual for each of the sub-set of the following temperature (X) values:
Frog ID#
1
3
9.
11
Temperature
9.
15
21
27
33
BHR (beats/min)
3
14
20
28
33
42
Predicted BHR
Residual
e. The first line of the regression Coefficients: table that you generated presents
results for (Intercept), including the estimate and results of a t-test for the Null
hypothesis that the y-intercept is 0.
(1) What is the biological interpretation of (Intercept) =-0.236?
(2) Explain the meaning of the p-value from the associated t-test.
13.6
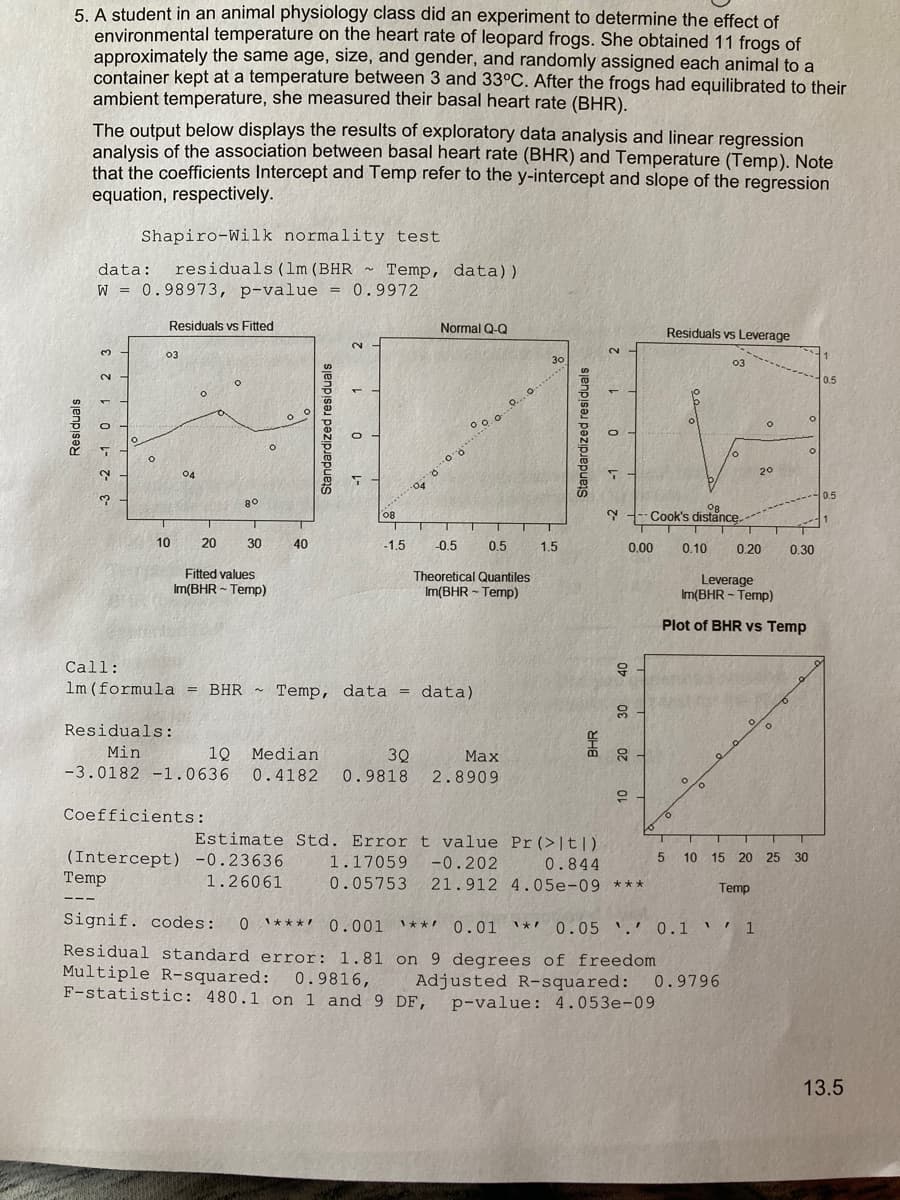
Transcribed Image Text:5. A student in an animal physiology class did an experiment to determine the effect of
environmental temperature on the heart rate of leopard frogs. She obtained 11 frogs of
approximately the same age, size, and gender, and randomly assigned each animal to a
container kept at a temperature between 3 and 33°C. After the frogs had equilibrated to their
ambient temperature, she measured their basal heart rate (BHR).
The output below displays the results of exploratory data analysis and linear regression
analysis of the association between basal heart rate (BHR) and Temperature (Temp). Note
that the coefficients Intercept and Temp refer to the y-intercept and slope of the regression
equation, respectively.
Shapiro-Wilk normality test
data:
residuals (1m (BHR ~ Temp, data))
W = 0.98973, p-value = 0.9972
%3D
Residuals vs Fitted
Normal Q-Q
Residuals vs Leverage
2.
03
30
03
0.5
04
20
0.5
80
Og
Y --- Cook's distance
08
10
20
30
40
-1.5
0.5
0.5
1.5
0,00
0.10
0.20
0.30
Fitted values
Im(BHR - Temp)
Theoretical Quantiles
Im(BHR - Temp)
Leverage
Im(BHR - Temp)
Plot of BHR vs Temp
Call:
40
lm (formula = BHR ~ Temp, data = data)
Residuals:
10 Median
-3.0182 -1.0636 0.4182
Min
3Q
Маx
20
0.9818 2.8909
Coefficients:
Estimate Std. Error t value Pr(>|t|)
1.
(Intercept) -0.23636
Temp
1.17059
-0.202
0.844
5.
10
15 20 25 30
1.26061
0.05753 21.912 4.05e-09 ***
Temp
Signif. codes: 0 '***' 0.001 I*** 0.01 I*! 0.05 '.' 0.1 ' ' 1
Residual standard error: 1.81 on 9 degrees of freedom
Multiple R-squared: 0.9816, Adjusted R-squared: 0.9796
F-statistic: 480.1 on 1 and 9 DF,
p-value: 4.053e-09
13.5
Residuals
-3 -2 -1 0 1 2 3
Standardized residuals
Standardized residuals
O L-
Expert Solution
This question has been solved!
Explore an expertly crafted, step-by-step solution for a thorough understanding of key concepts.

Step by step
Solved in 4 steps

Recommended textbooks for you
Linear Algebra: A Modern Introduction
Algebra
ISBN:
9781285463247
Author:
David Poole
Publisher:
Cengage Learning

Algebra & Trigonometry with Analytic Geometry
Algebra
ISBN:
9781133382119
Author:
Swokowski
Publisher:
Cengage

Glencoe Algebra 1, Student Edition, 9780079039897…
Algebra
ISBN:
9780079039897
Author:
Carter
Publisher:
McGraw Hill
Linear Algebra: A Modern Introduction
Algebra
ISBN:
9781285463247
Author:
David Poole
Publisher:
Cengage Learning
Algebra & Trigonometry with Analytic Geometry
Algebra
ISBN:
9781133382119
Author:
Swokowski
Publisher:
Cengage
Glencoe Algebra 1, Student Edition, 9780079039897…
Algebra
ISBN:
9780079039897
Author:
Carter
Publisher:
McGraw Hill