A study compared men who viewed high levels of television violence as children with those who did not in order to study the differences with regard to physical abuse of their partners as adults. Use the table shown below to complete parts a through c. High TV Violence Low TV Violence O Yes, Physical Abuse No Physical Abuse 15 26 20 93 a. Find the row, column, and grand totals, and prepare a table showing these values as well as the counts given. High TV Violence Low TV Violence Total Yes, Physical Abuse 15 26 No Physical Abuse 20 93 Total (Type whole numbers.) b. Find the percentage of men overall who were abusive. (Round to two decimal places as needed.) c. Find the expected number of men exposed to high levels other expected values by knowing that the expected values must add to the row and column totals. television violence who should say yes, if the variables are independent. Multiply the proportion overall that were abusive times the number of men exposed to high levels of television violence. Then find the High TV Violence Low TV Violence 26 (O 93 () (Round to two decimal places as needed.) 15 (O) 20 (O Yes, Physical Abuse No Physical Abuse
A study compared men who viewed high levels of television violence as children with those who did not in order to study the differences with regard to physical abuse of their partners as adults. Use the table shown below to complete parts a through c. High TV Violence Low TV Violence O Yes, Physical Abuse No Physical Abuse 15 26 20 93 a. Find the row, column, and grand totals, and prepare a table showing these values as well as the counts given. High TV Violence Low TV Violence Total Yes, Physical Abuse 15 26 No Physical Abuse 20 93 Total (Type whole numbers.) b. Find the percentage of men overall who were abusive. (Round to two decimal places as needed.) c. Find the expected number of men exposed to high levels other expected values by knowing that the expected values must add to the row and column totals. television violence who should say yes, if the variables are independent. Multiply the proportion overall that were abusive times the number of men exposed to high levels of television violence. Then find the High TV Violence Low TV Violence 26 (O 93 () (Round to two decimal places as needed.) 15 (O) 20 (O Yes, Physical Abuse No Physical Abuse

Glencoe Algebra 1, Student Edition, 9780079039897, 0079039898, 2018
18th Edition
ISBN:9780079039897
Author:Carter
Publisher:Carter
Chapter10: Statistics
Section10.6: Summarizing Categorical Data
Problem 25PPS

Related questions
Topic Video
Question
Please help.
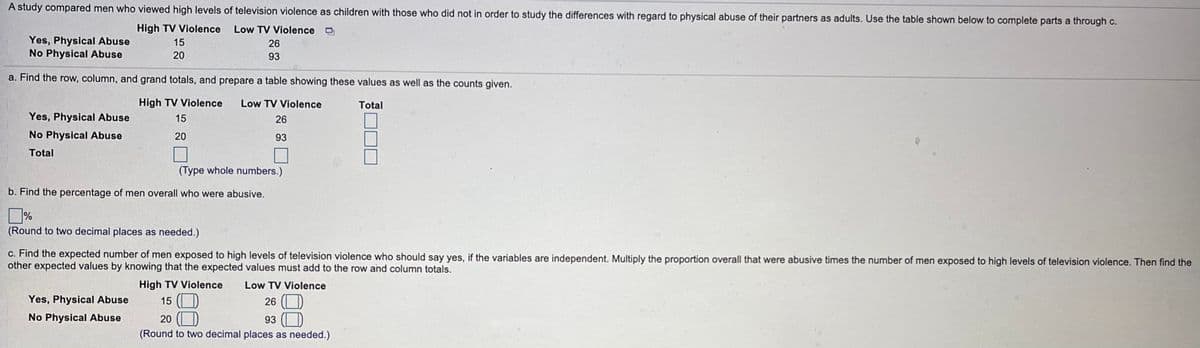
Transcribed Image Text:A study compared men who viewed high levels of television violence as children with those who did not in order to study the differences with regard to physical abuse of their partners as adults. Use the table shown below to complete parts a through c.
High TV Violence
Low TV Violence O
Yes, Physical Abuse
No Physical Abuse
15
26
20
93
a. Find the row, column, and grand totals, and prepare a table showing these values as well as the counts given.
High TV Violence
Low TV Violence
Total
Yes, Physical Abuse
15
26
No Physical Abuse
20
93
Total
(Type whole numbers.)
b. Find the percentage of men overall who were abusive.
%
(Round to two decimal places as needed.)
c. Find the expected number of men exposed to high levels of television violence who should say yes, if the variables are independent. Multiply the proportion overall that were abusive times the number of men exposed to high levels of television violence. Then find the
other expected values by knowing that the expected values must add to the row and column totals.
High TV Violence
Low TV Violence
26 (O
93 (O
(Round to two decimal places as needed.)
15 (
20 (O
Yes, Physical Abuse
No Physical Abuse
Expert Solution
This question has been solved!
Explore an expertly crafted, step-by-step solution for a thorough understanding of key concepts.

This is a popular solution!

Trending now
This is a popular solution!

Step by step
Solved in 2 steps with 1 images

Knowledge Booster


Learn more about
Need a deep-dive on the concept behind this application? Look no further. Learn more about this topic, statistics and related others by exploring similar questions and additional content below.Recommended textbooks for you
Glencoe Algebra 1, Student Edition, 9780079039897…
Algebra
ISBN:
9780079039897
Author:
Carter
Publisher:
McGraw Hill

Holt Mcdougal Larson Pre-algebra: Student Edition…
Algebra
ISBN:
9780547587776
Author:
HOLT MCDOUGAL
Publisher:
HOLT MCDOUGAL
Glencoe Algebra 1, Student Edition, 9780079039897…
Algebra
ISBN:
9780079039897
Author:
Carter
Publisher:
McGraw Hill
Holt Mcdougal Larson Pre-algebra: Student Edition…
Algebra
ISBN:
9780547587776
Author:
HOLT MCDOUGAL
Publisher:
HOLT MCDOUGAL